there are 273 participants| Statistic | Age (yrs) |
|---|---|
| Mean (std) | 27.2 (8.4) |
| std | 8.4 |
| min | 18.0 |
| max | 73.0 |
| Median (range) | 25.0 (18.0-73.0) |
there are 273 participants| Statistic | Age (yrs) |
|---|---|
| Mean (std) | 27.2 (8.4) |
| std | 8.4 |
| min | 18.0 |
| max | 73.0 |
| Median (range) | 25.0 (18.0-73.0) |
| Sex | Count | Percentage | |
|---|---|---|---|
| 0 | Male | 156 | 0.571429 |
| 1 | Female | 117 | 0.428571 |
| Country of Birth | Count | Percentage | |
|---|---|---|---|
| 0 | Uganda | 164 | 0.600733 |
| 1 | Sudan (Khartoum) | 22 | 0.080586 |
| 2 | South Sudan | 21 | 0.076923 |
| 3 | Somalia | 19 | 0.069597 |
| 4 | Eritrea | 17 | 0.062271 |
| 5 | Democratic Republic of Congo | 14 | 0.051282 |
| 6 | Kenya | 5 | 0.018315 |
| 7 | Ethiopia | 5 | 0.018315 |
| 8 | Nigeria (Abuja) | 3 | 0.010989 |
| 9 | Rwanda | 1 | 0.003663 |
| 10 | Ghana (Accra) | 1 | 0.003663 |
| 11 | Chad (N'Djamena) | 1 | 0.003663 |
| Ethnicity | Count | Percentage | |
|---|---|---|---|
| 0 | 1, Bantu | 134 | 0.490842 |
| 1 | 24, Other | 59 | 0.216117 |
| 2 | 2, Nilotes | 28 | 0.102564 |
| 3 | 3, Nilohamites | 19 | 0.069597 |
| 4 | 20, Somali | 19 | 0.069597 |
| 5 | 5, Arabs | 4 | 0.014652 |
| 6 | 6, Amhara | 4 | 0.014652 |
| 7 | 4, Hamites | 2 | 0.007326 |
| 8 | 13, Igbo | 2 | 0.007326 |
| 9 | 15, Kongo | 1 | 0.003663 |
| 10 | 22, Yoruba | 1 | 0.003663 |
This is the mean ITA by site and ethnicity
| Ethnicity | 1, Bantu | 13, Igbo | 15, Kongo | 2, Nilotes | 20, Somali | 22, Yoruba | 24, Other | 3, Nilohamites | 4, Hamites | 5, Arabs | 6, Amhara |
|---|---|---|---|---|---|---|---|---|---|---|---|
| Group | |||||||||||
| Back of Hand (C) | -56.08 | -22.10 | -48.15 | -60.40 | -47.29 | -26.33 | -45.81 | -59.63 | -62.45 | -19.93 | -22.44 |
| Dorsal - DIP (B) | -59.49 | -9.37 | -50.61 | -62.87 | -50.62 | -60.07 | -49.63 | -61.91 | -70.06 | -18.84 | -19.55 |
| Fingernail (A) | 15.09 | 21.43 | -22.18 | 9.24 | 30.61 | 52.09 | 27.34 | nan | nan | nan | 40.08 |
| Forehead (F) | -54.64 | -32.03 | -60.90 | -62.46 | -49.78 | -45.18 | -44.32 | -61.92 | -54.44 | -3.53 | -20.32 |
| Inner Upper Arm (E) | -38.89 | 0.18 | -44.77 | -45.32 | -28.68 | -13.42 | -24.50 | -42.56 | -46.25 | 0.23 | 6.19 |
| Palmar - Opposite DIP (D) | 10.11 | 26.27 | 2.81 | 8.67 | 5.79 | 33.44 | 12.42 | 6.41 | 21.21 | 12.65 | 16.97 |
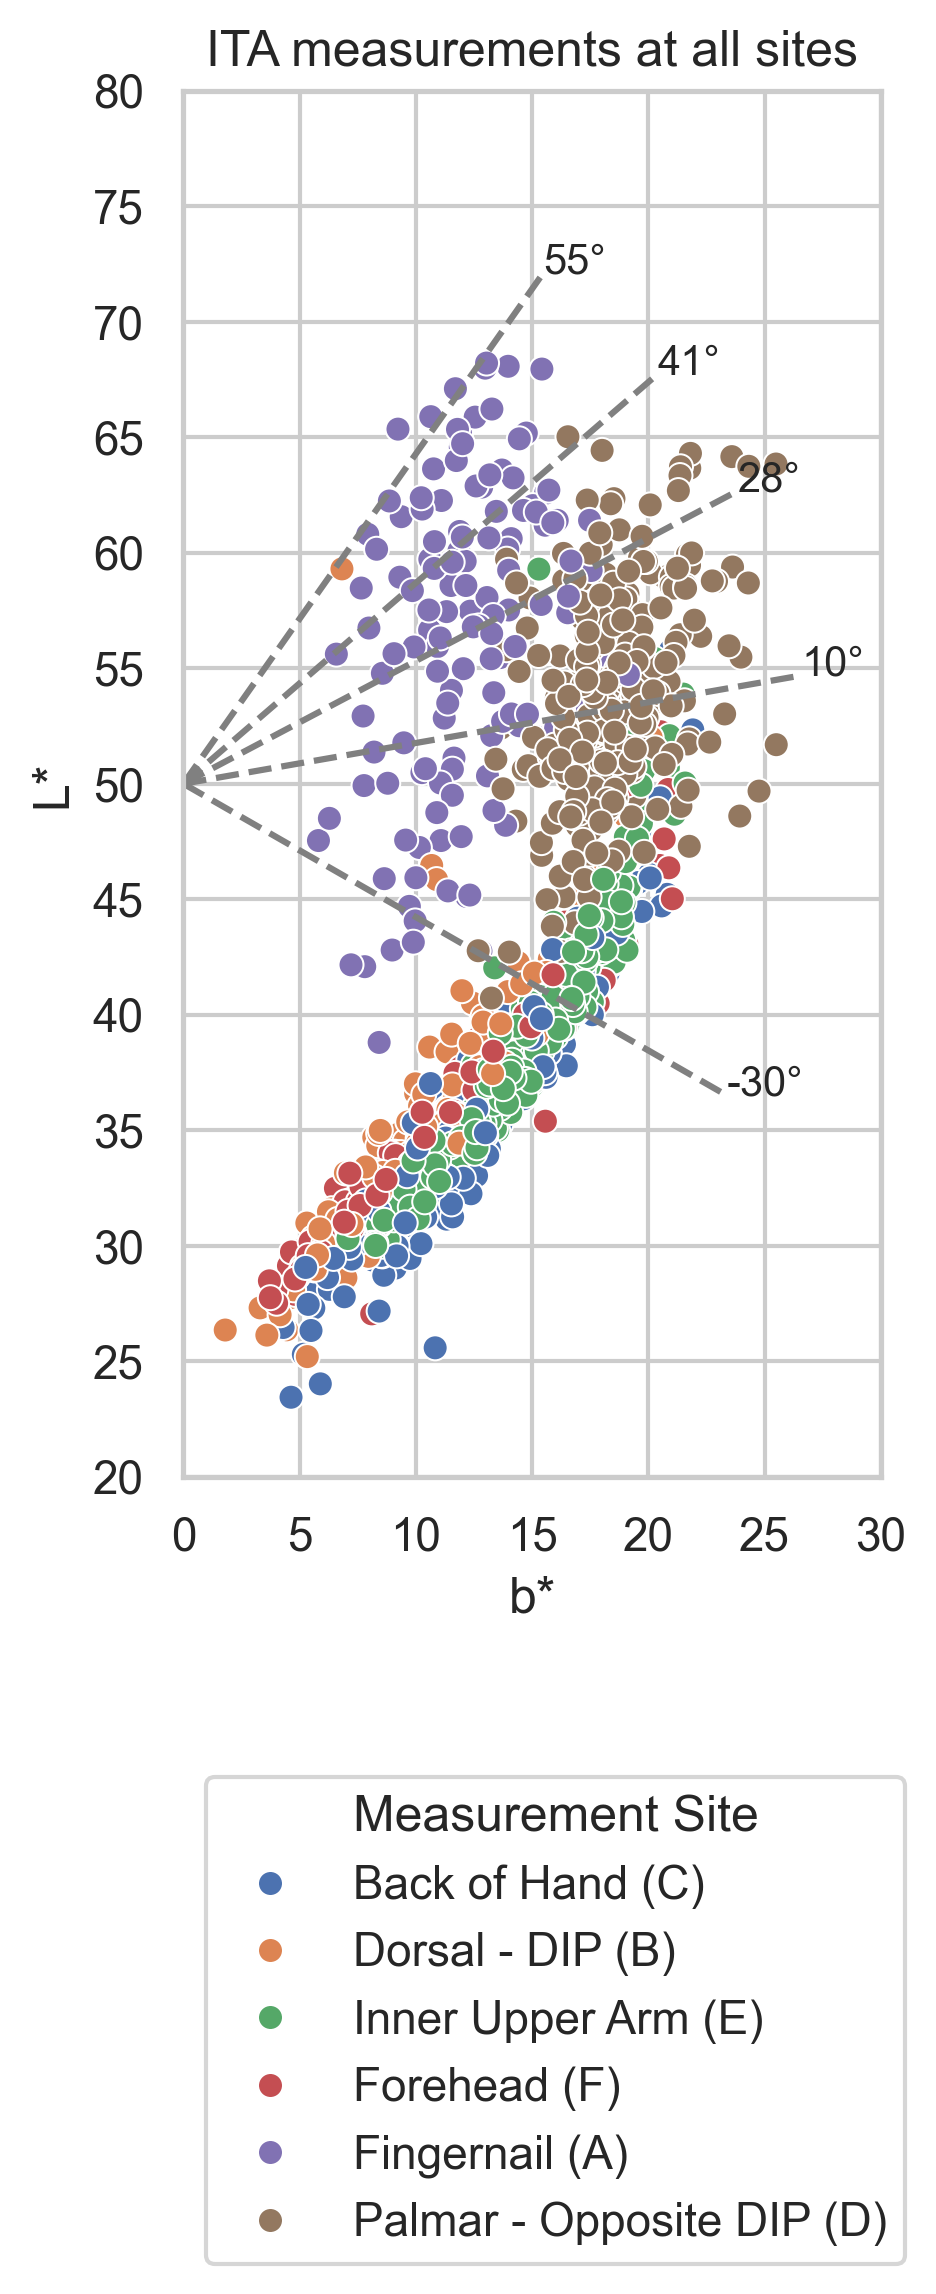
| Statistic | count | mean | std | min | 25% | 50% | 75% | max |
|---|---|---|---|---|---|---|---|---|
| Back of Hand (C) | 272.0 | -52.6 | 17.8 | -80.2 | -65.4 | -57.3 | -43.9 | 15.3 |
| Dorsal - DIP (B) | 272.0 | -55.8 | 18.8 | -85.6 | -69.2 | -60.6 | -47.0 | 53.7 |
| Fingernail (A) | 132.0 | 22.9 | 26.2 | -53.1 | 8.8 | 29.8 | 42.5 | 58.9 |
| Forehead (F) | 272.0 | -52.0 | 19.4 | -80.5 | -67.4 | -56.7 | -39.9 | 16.7 |
| Inner Upper Arm (E) | 272.0 | -34.5 | 20.2 | -70.2 | -49.2 | -36.9 | -22.8 | 31.3 |
| Palmar - Opposite DIP (D) | 272.0 | 10.3 | 13.2 | -35.1 | 2.4 | 11.0 | 20.3 | 42.2 |
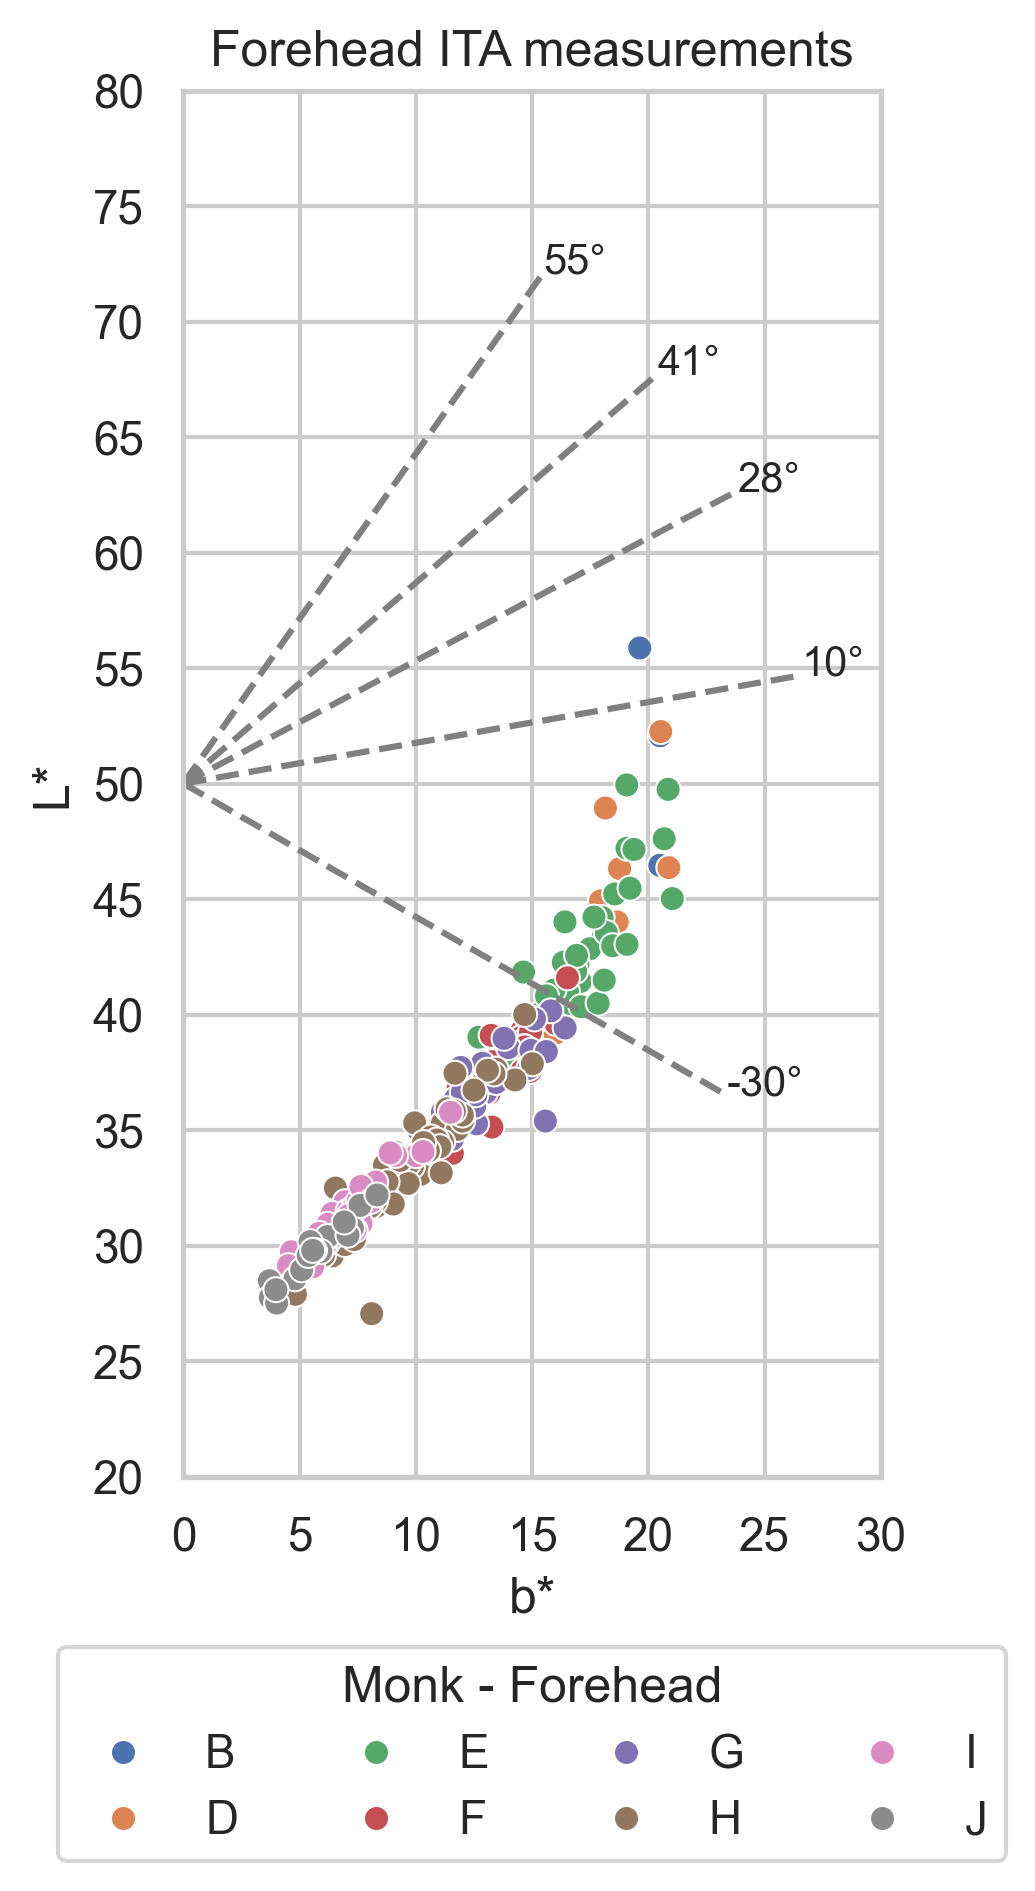
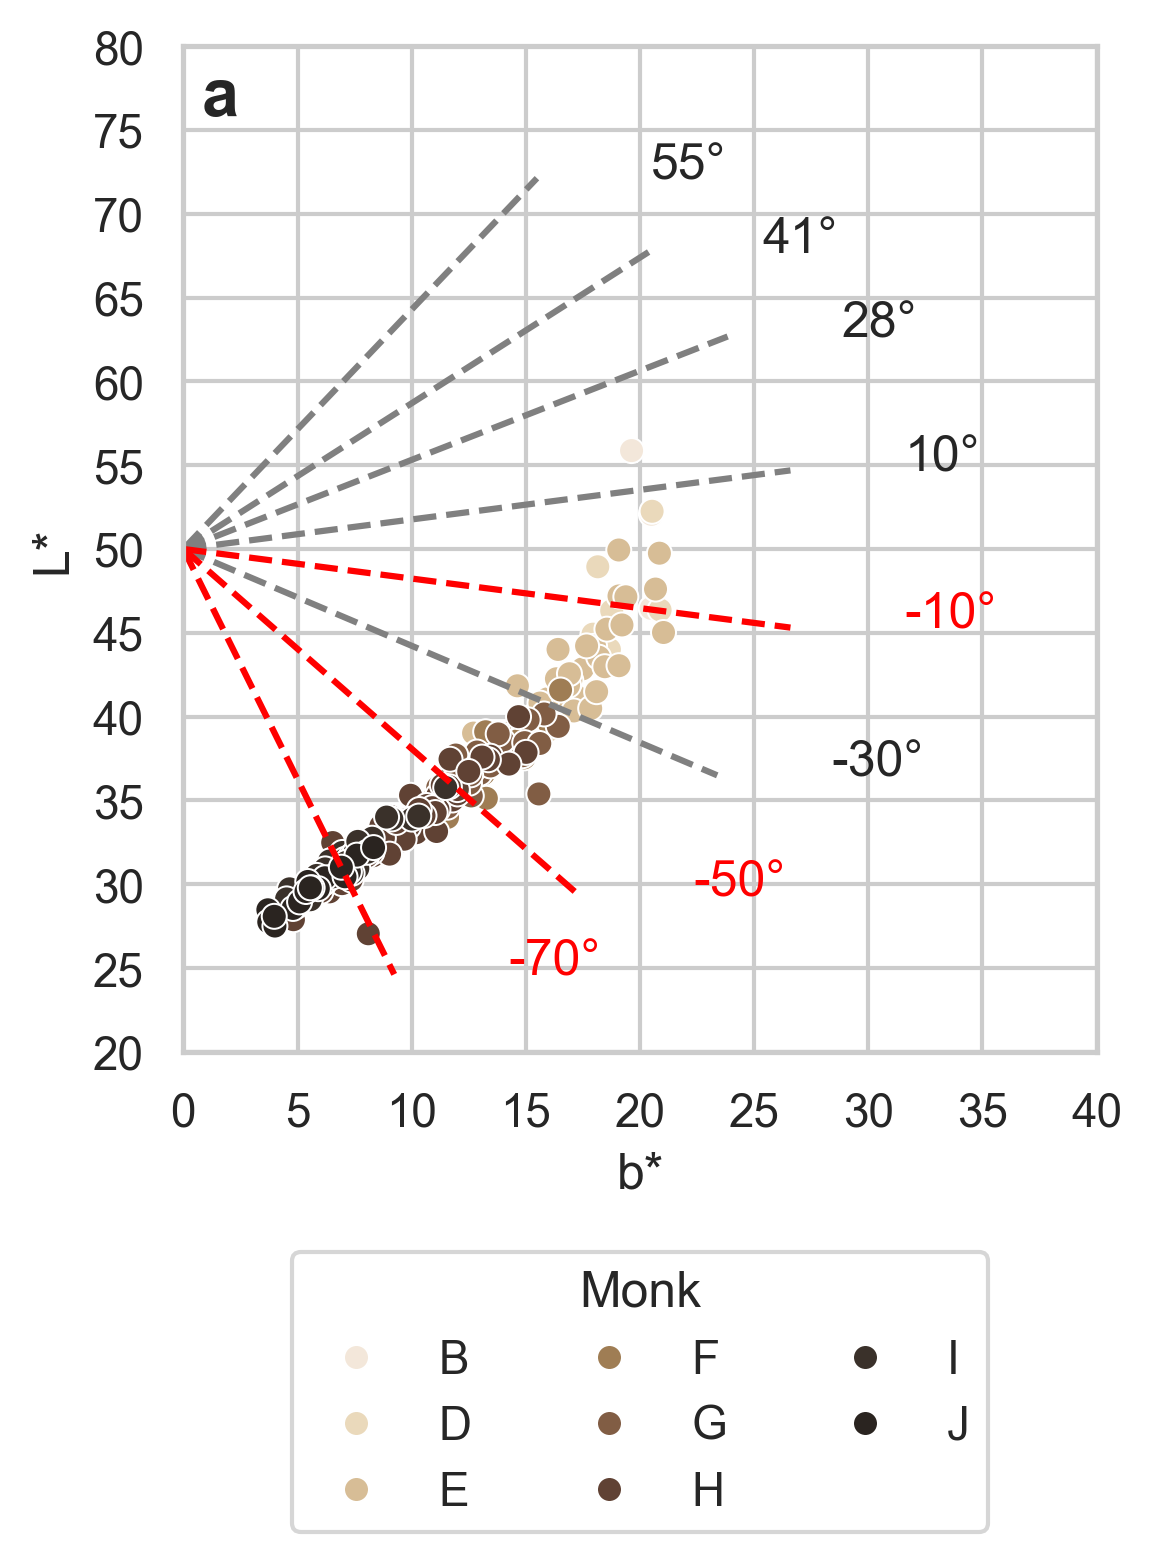
Mean forehead ITA by Monk measurement
| mean | median | std | IQR | |
|---|---|---|---|---|
| Monk - FH (F) | ||||
| B | 4.21 | 5.76 | 13.30 | 13.23 |
| D | -19.43 | -20.97 | 13.34 | 16.86 |
| E | -24.63 | -25.18 | 11.90 | 12.35 |
| F | -41.74 | -39.69 | 7.74 | 11.14 |
| G | -50.78 | -49.43 | 9.01 | 13.08 |
| H | -62.21 | -63.86 | 8.91 | 11.21 |
| I | -69.24 | -69.16 | 6.57 | 6.52 |
| J | -74.17 | -74.62 | 4.67 | 7.29 |
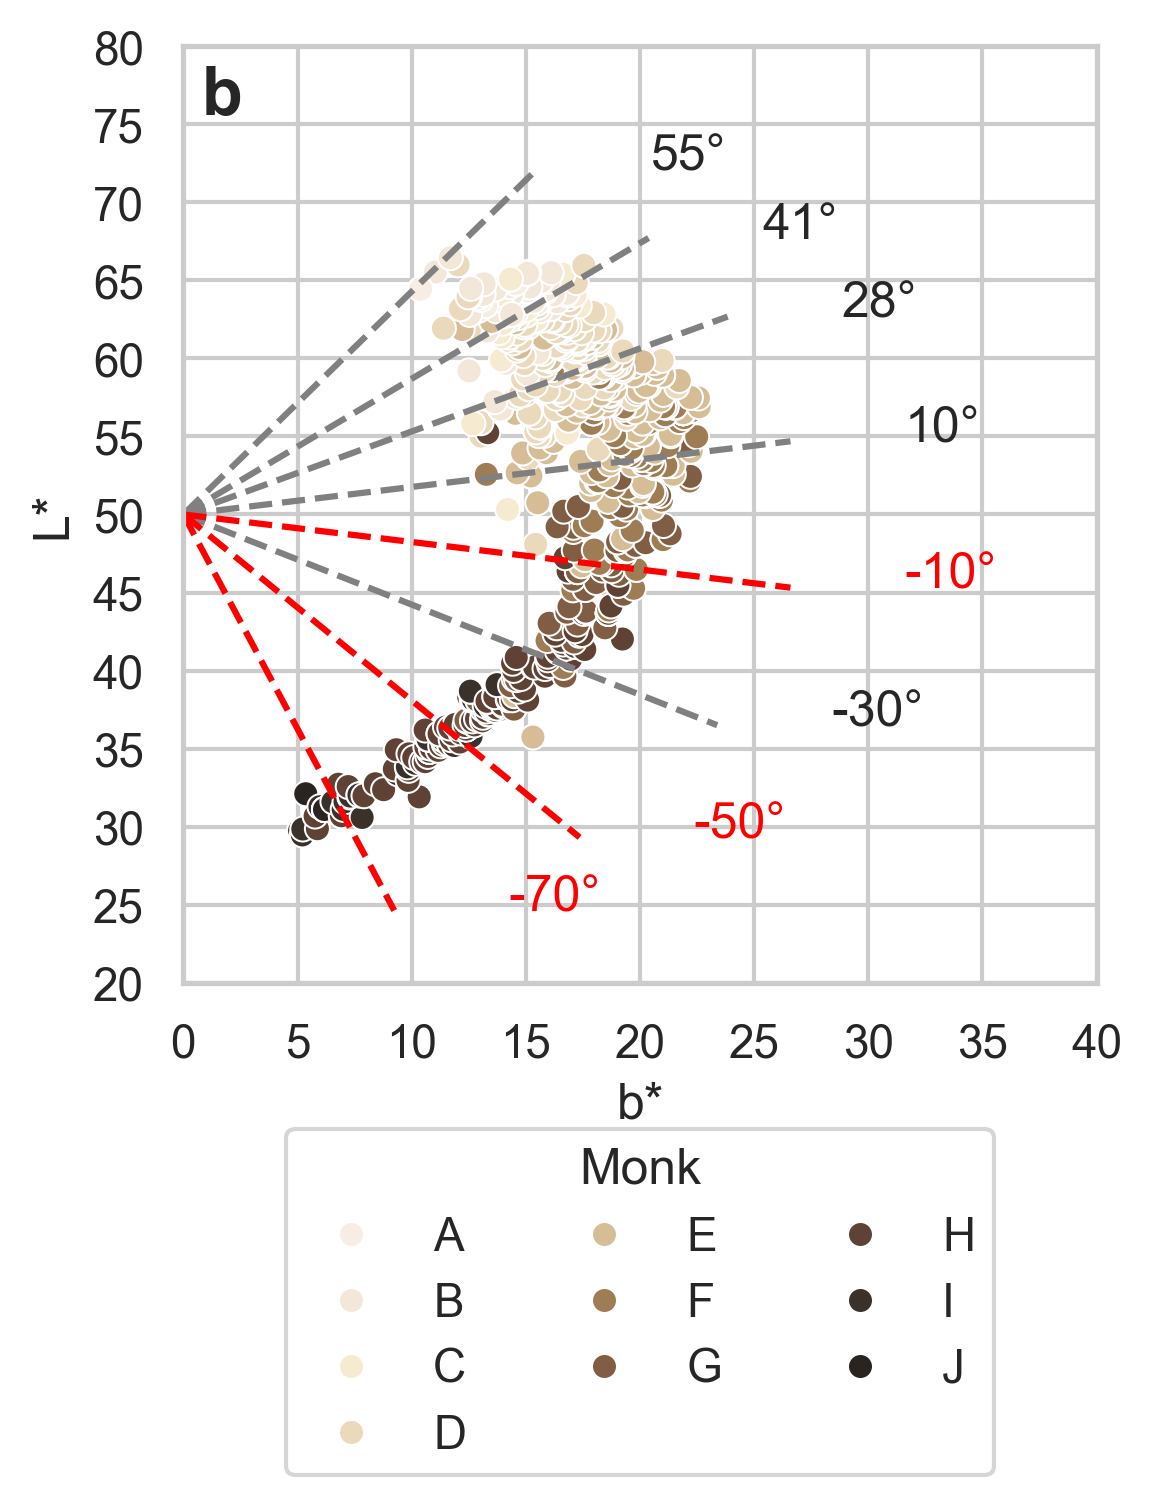
How does this compare to the San Francisco data?
| count | median | IQR | ||||
|---|---|---|---|---|---|---|
| Source | SF | Uganda | SF | Uganda | SF | Uganda |
| MST Forehead | ||||||
| A | 4.00 | nan | 50.08 | nan | 12.21 | nan |
| B | 33.00 | 3.00 | 43.07 | 5.76 | 9.94 | 13.23 |
| C | 34.00 | nan | 41.29 | nan | 11.93 | nan |
| D | 115.00 | 12.00 | 33.47 | -20.97 | 11.37 | 16.86 |
| E | 190.00 | 37.00 | 24.72 | -25.18 | 12.42 | 12.35 |
| F | 116.00 | 20.00 | 12.54 | -39.69 | 15.15 | 11.14 |
| G | 77.00 | 51.00 | -13.02 | -49.43 | 17.71 | 13.08 |
| H | 90.00 | 93.00 | -44.49 | -63.86 | 25.84 | 11.21 |
| I | 16.00 | 31.00 | -58.09 | -69.16 | 20.37 | 6.52 |
| J | 2.00 | 17.00 | -72.61 | -74.62 | 0.70 | 7.29 |
Wilcoxon Signed-Rank Test Results for Dorsal - DIP (B)
  AMT510 ITA: W-statistic = 3085.0000, p-value = < 0.001
  RM200QC ITA: W-statistic = 6172.0000, p-value = < 0.001
  ColorReader Pro ITA: W-statistic = 8902.0000, p-value = < 0.001

Wilcoxon Signed-Rank Test Results for Palmar - Opposite DIP (D)
  AMT510 ITA: W-statistic = 7.0000, p-value = < 0.001
  RM200QC ITA: W-statistic = 4337.0000, p-value = < 0.001
  ColorReader Pro ITA: W-statistic = 89.0000, p-value = < 0.001

Wilcoxon Signed-Rank Test Results for Back of Hand (C)
  AMT510 ITA: W-statistic = 4185.0000, p-value = < 0.001
  RM200QC ITA: W-statistic = 13921.0000, p-value = < 0.001
  ColorReader Pro ITA: W-statistic = 4764.0000, p-value = < 0.001

Wilcoxon Signed-Rank Test Results for Inner Upper Arm (E)
  AMT510 ITA: W-statistic = 907.0000, p-value = < 0.001
  RM200QC ITA: W-statistic = 15814.0000, p-value = 0.0665
  ColorReader Pro ITA: W-statistic = 803.0000, p-value = < 0.001

Wilcoxon Signed-Rank Test Results for Forehead (F)
  AMT510 ITA: W-statistic = 5694.0000, p-value = < 0.001
  RM200QC ITA: W-statistic = 12721.0000, p-value = < 0.001
  ColorReader Pro ITA: W-statistic = 10139.0000, p-value = < 0.001

Wilcoxon Signed-Rank Test Results for Fingernail (A)
  AMT510 ITA: W-statistic = 506.0000, p-value = < 0.001
  RM200QC ITA: W-statistic = 2580.0000, p-value = < 0.001
  ColorReader Pro ITA: W-statistic = 3571.0000, p-value = 0.8772
Pairplot for Back of Hand (C)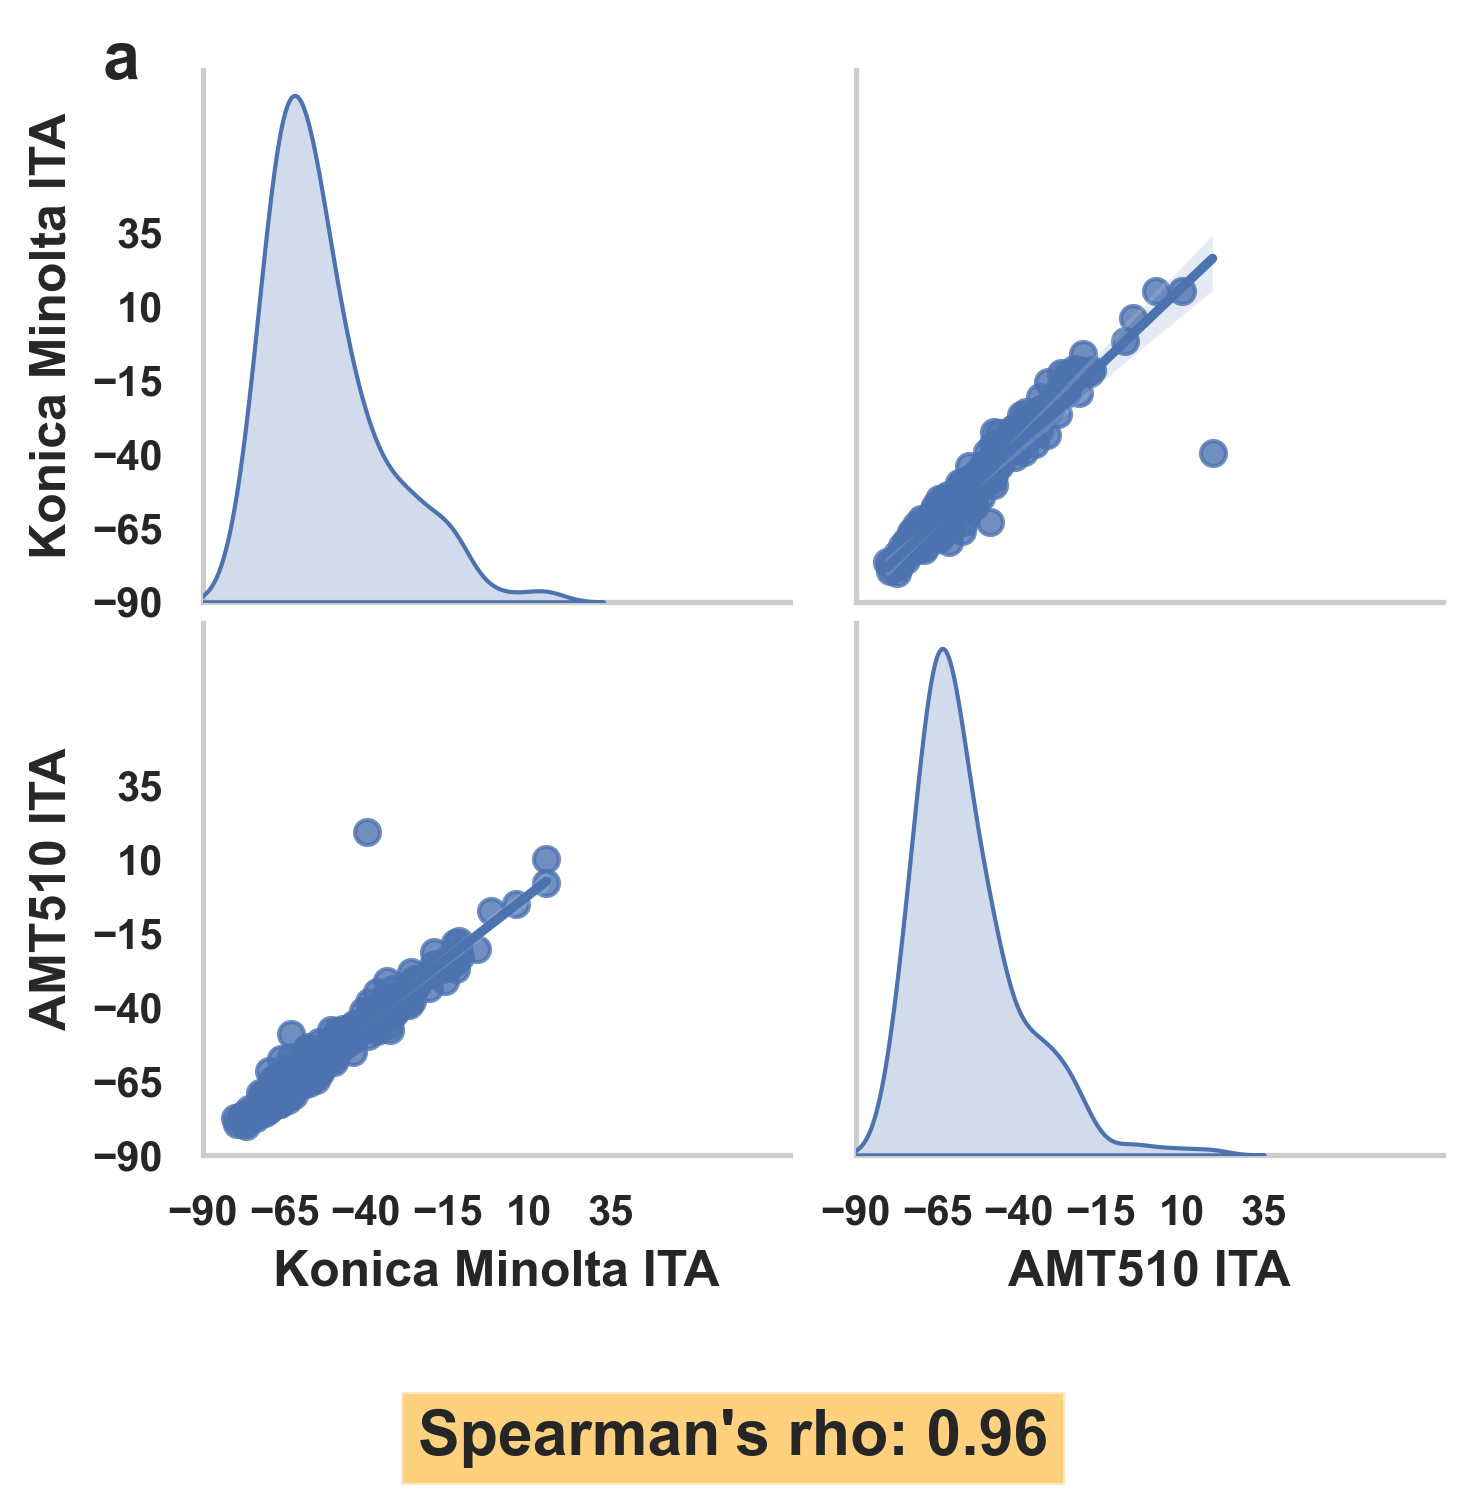

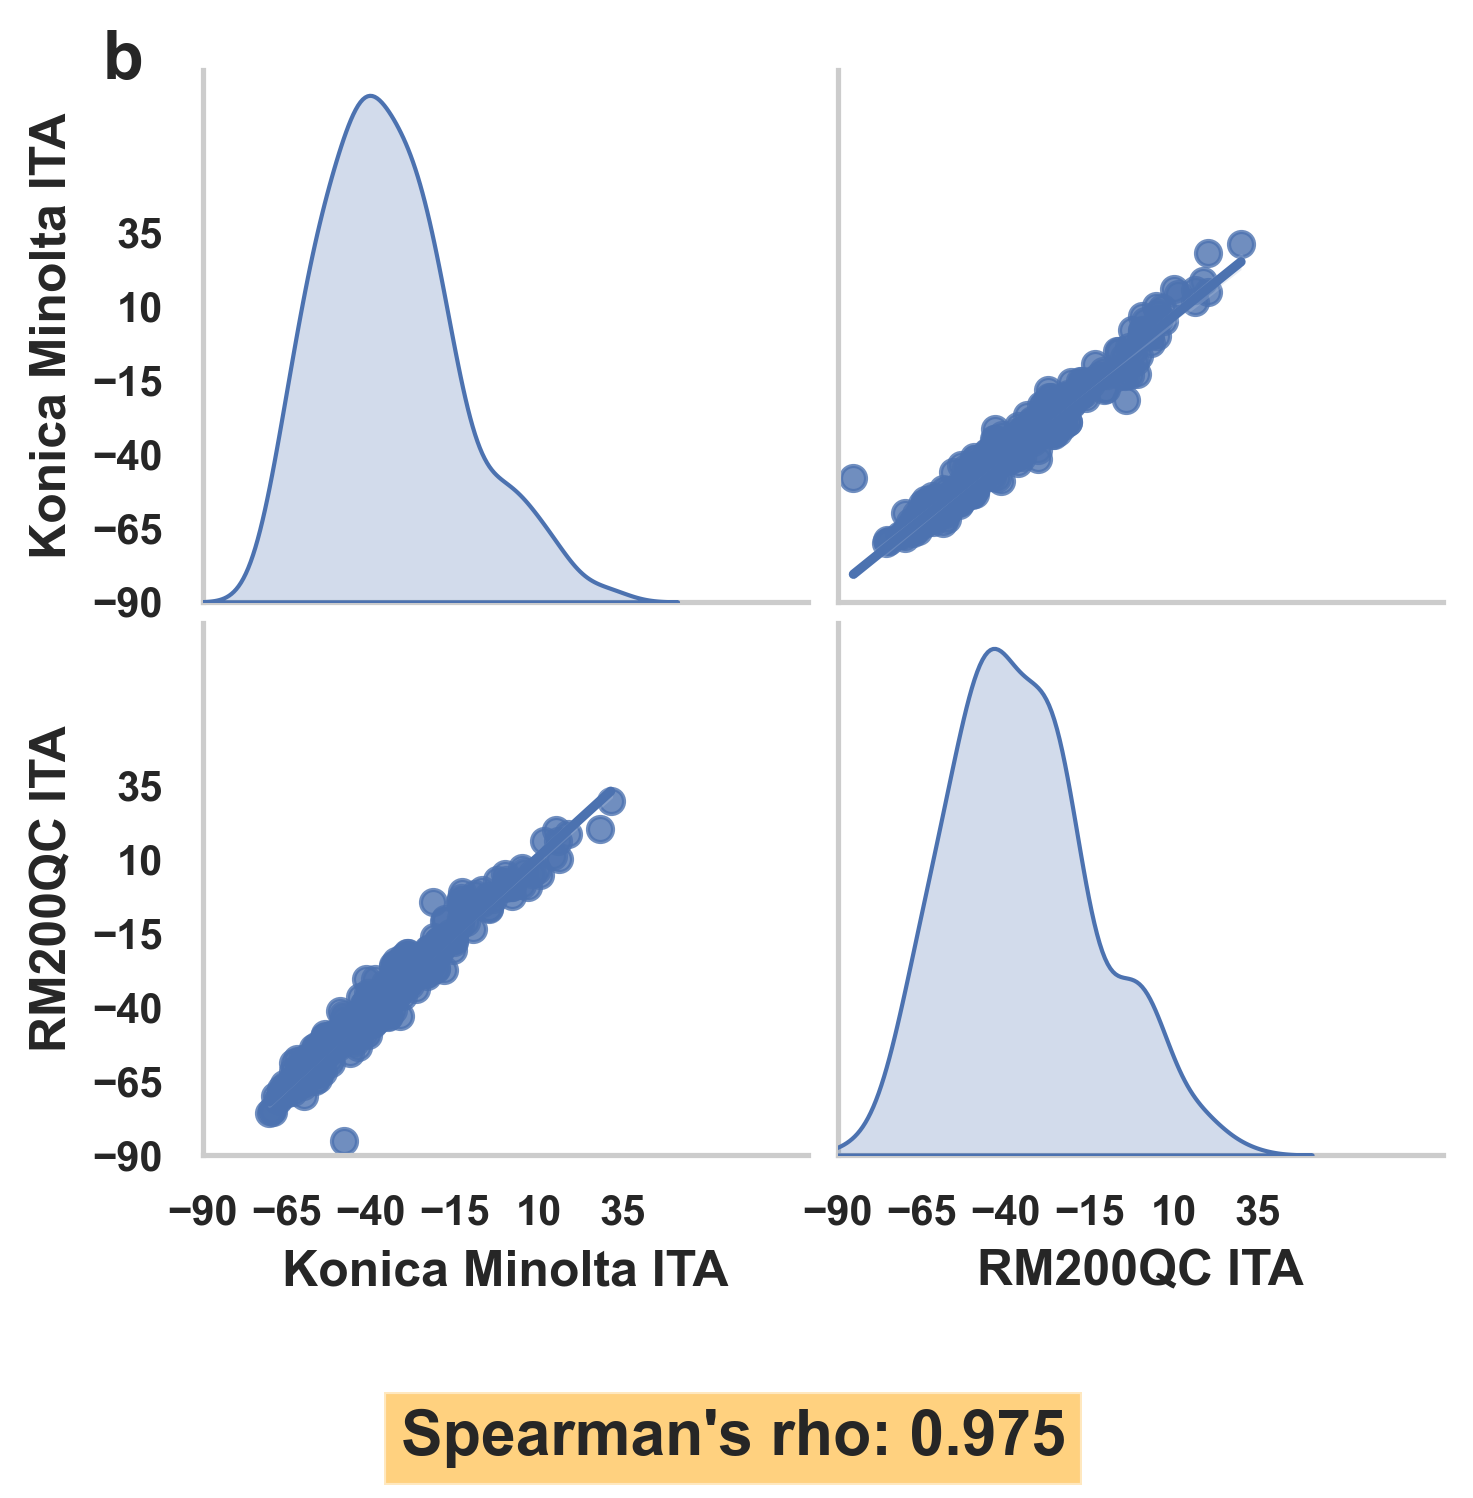
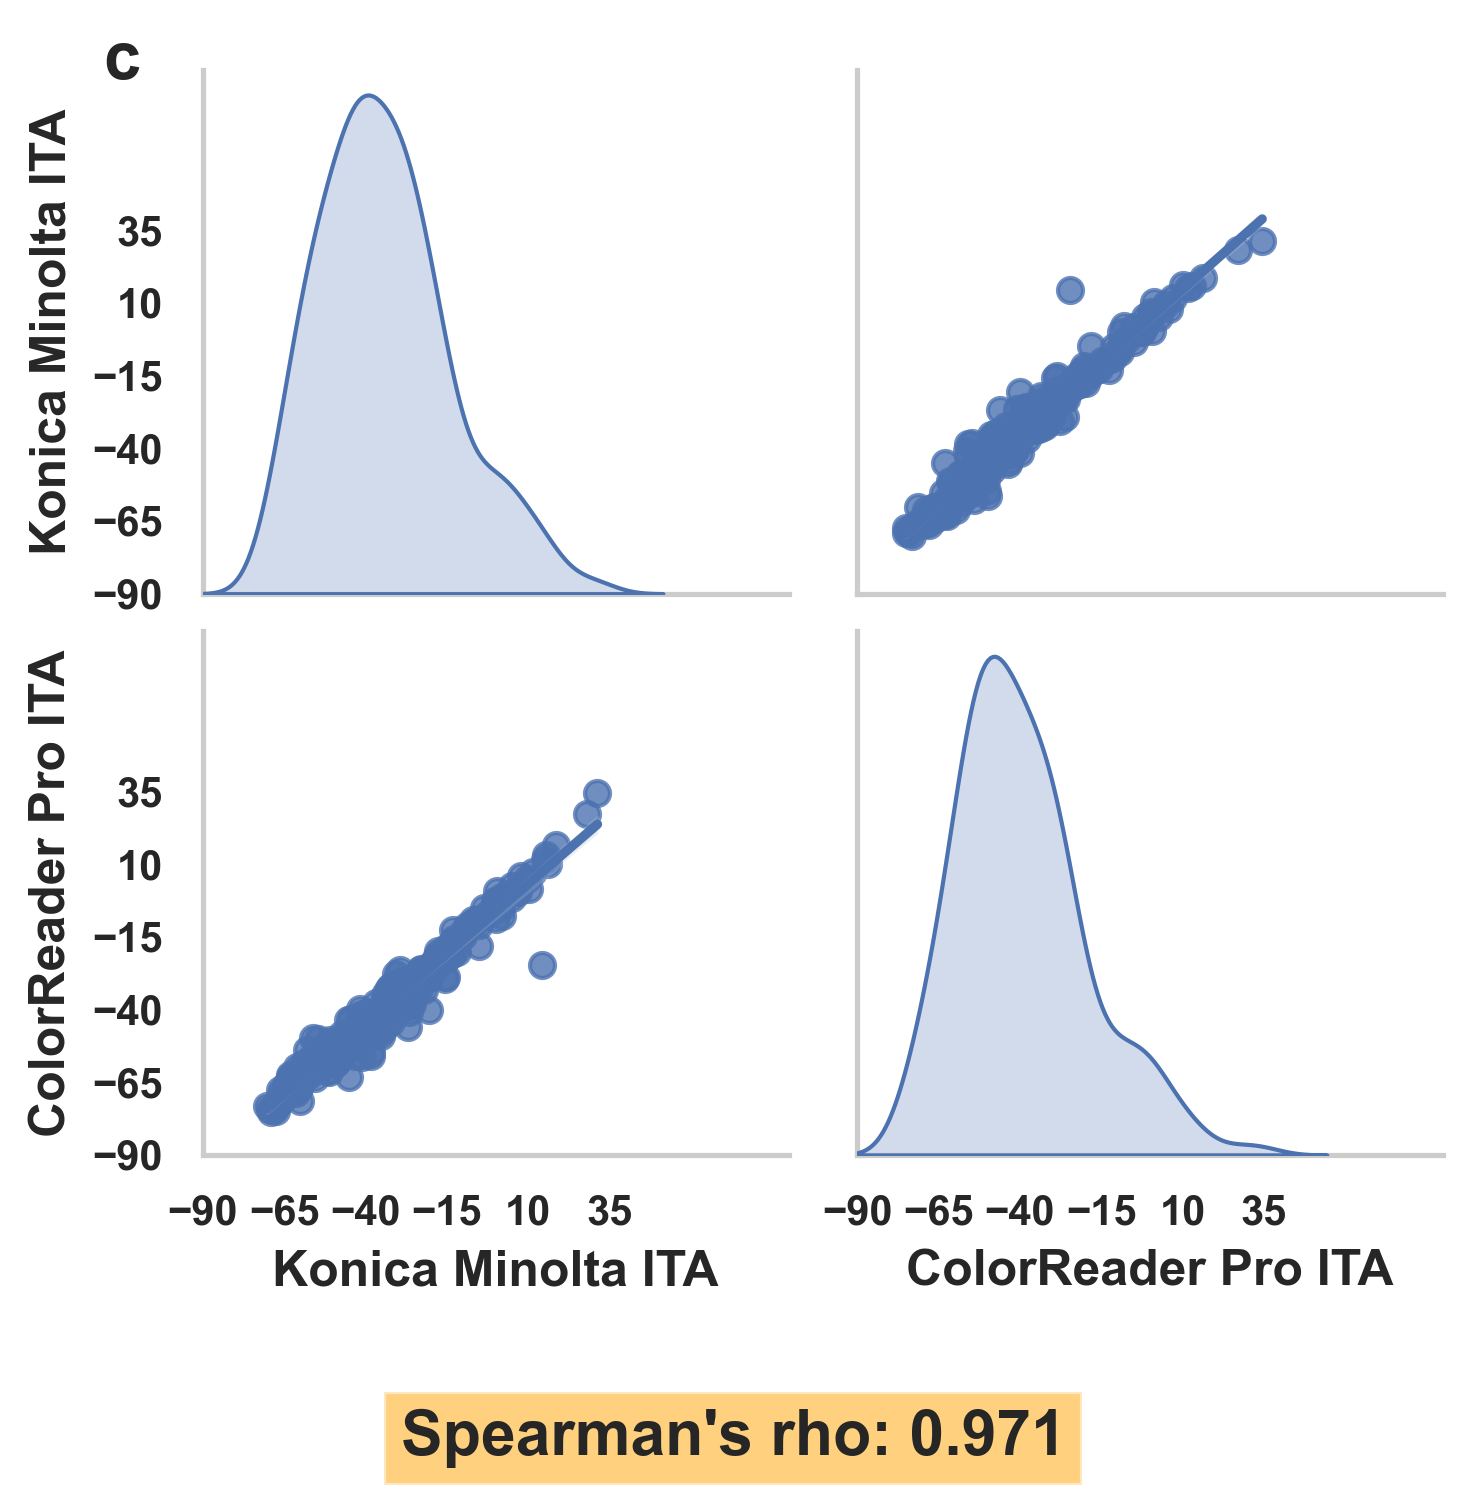
Pairplot for Dorsal - DIP (B)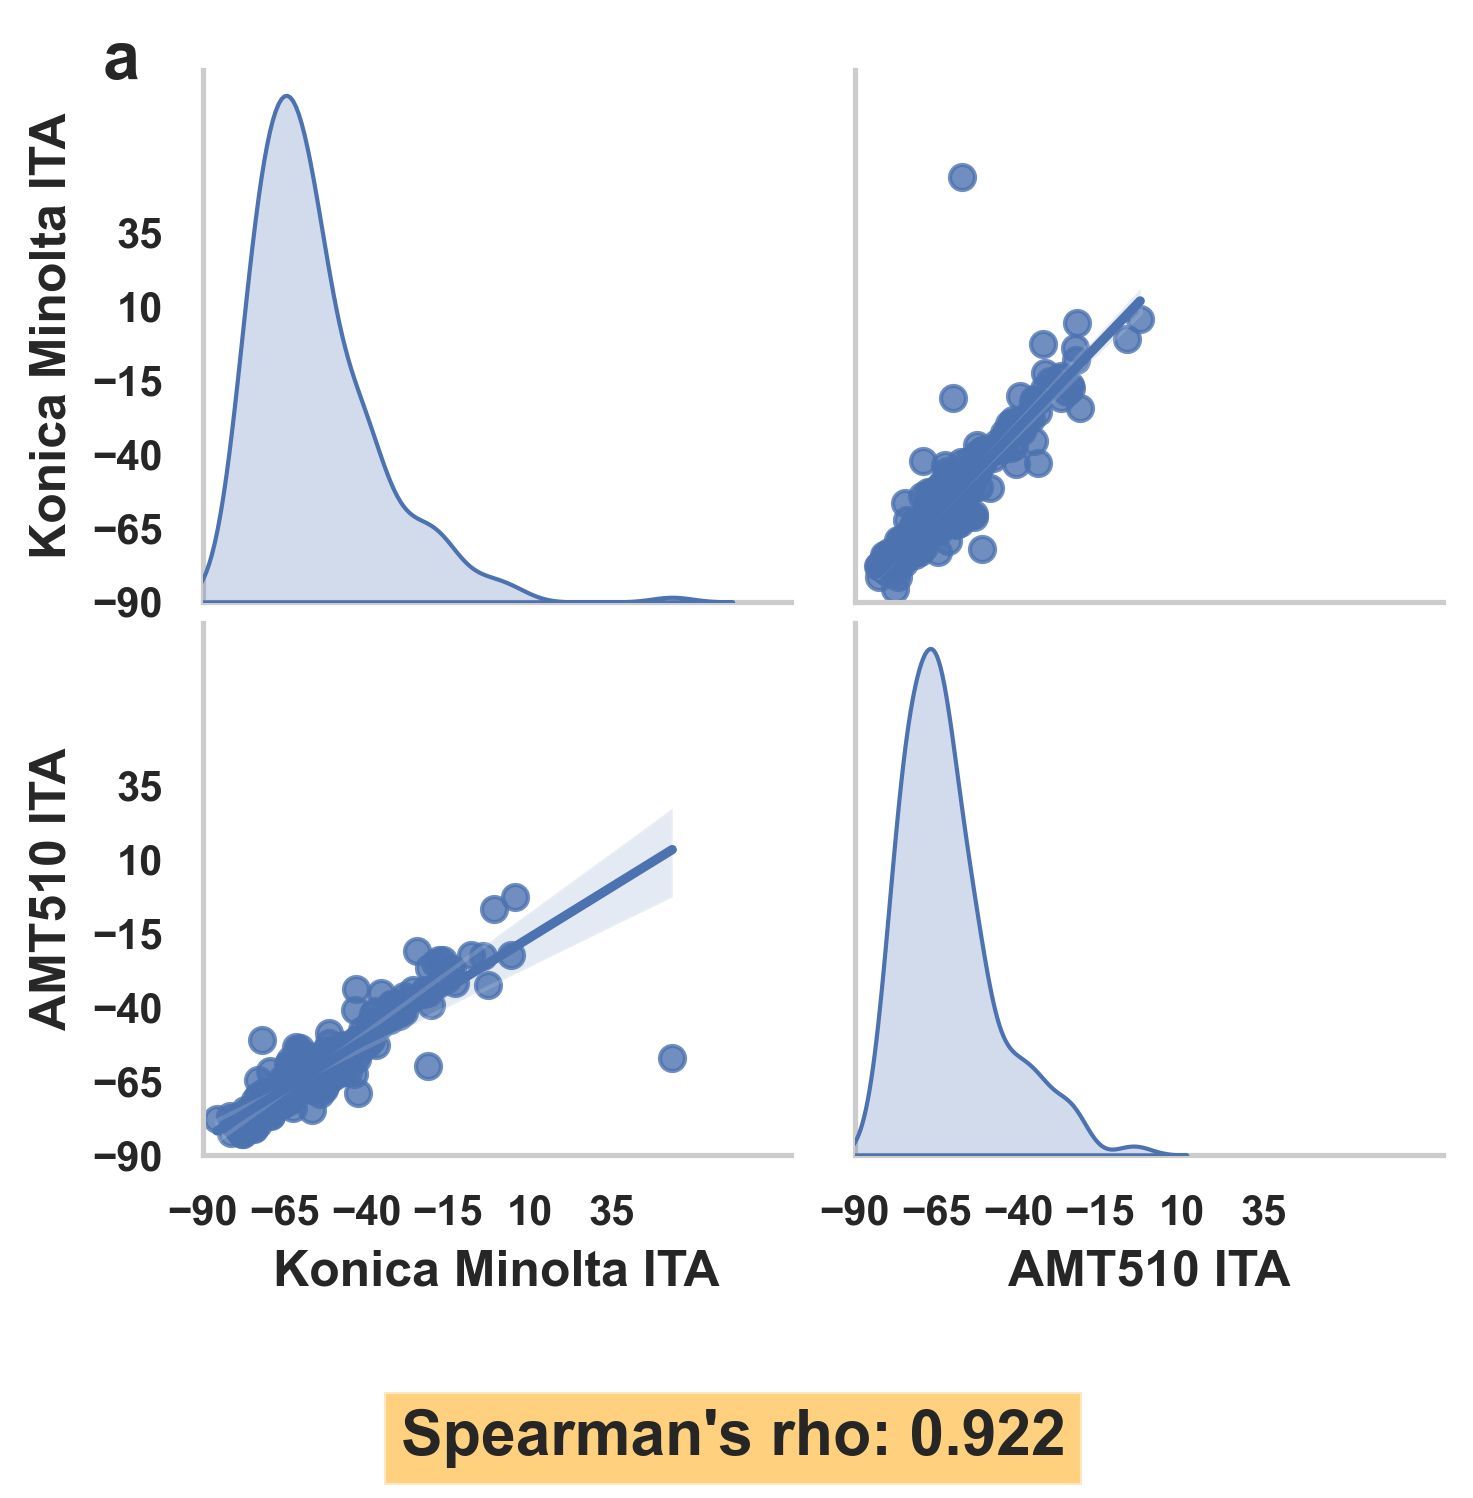
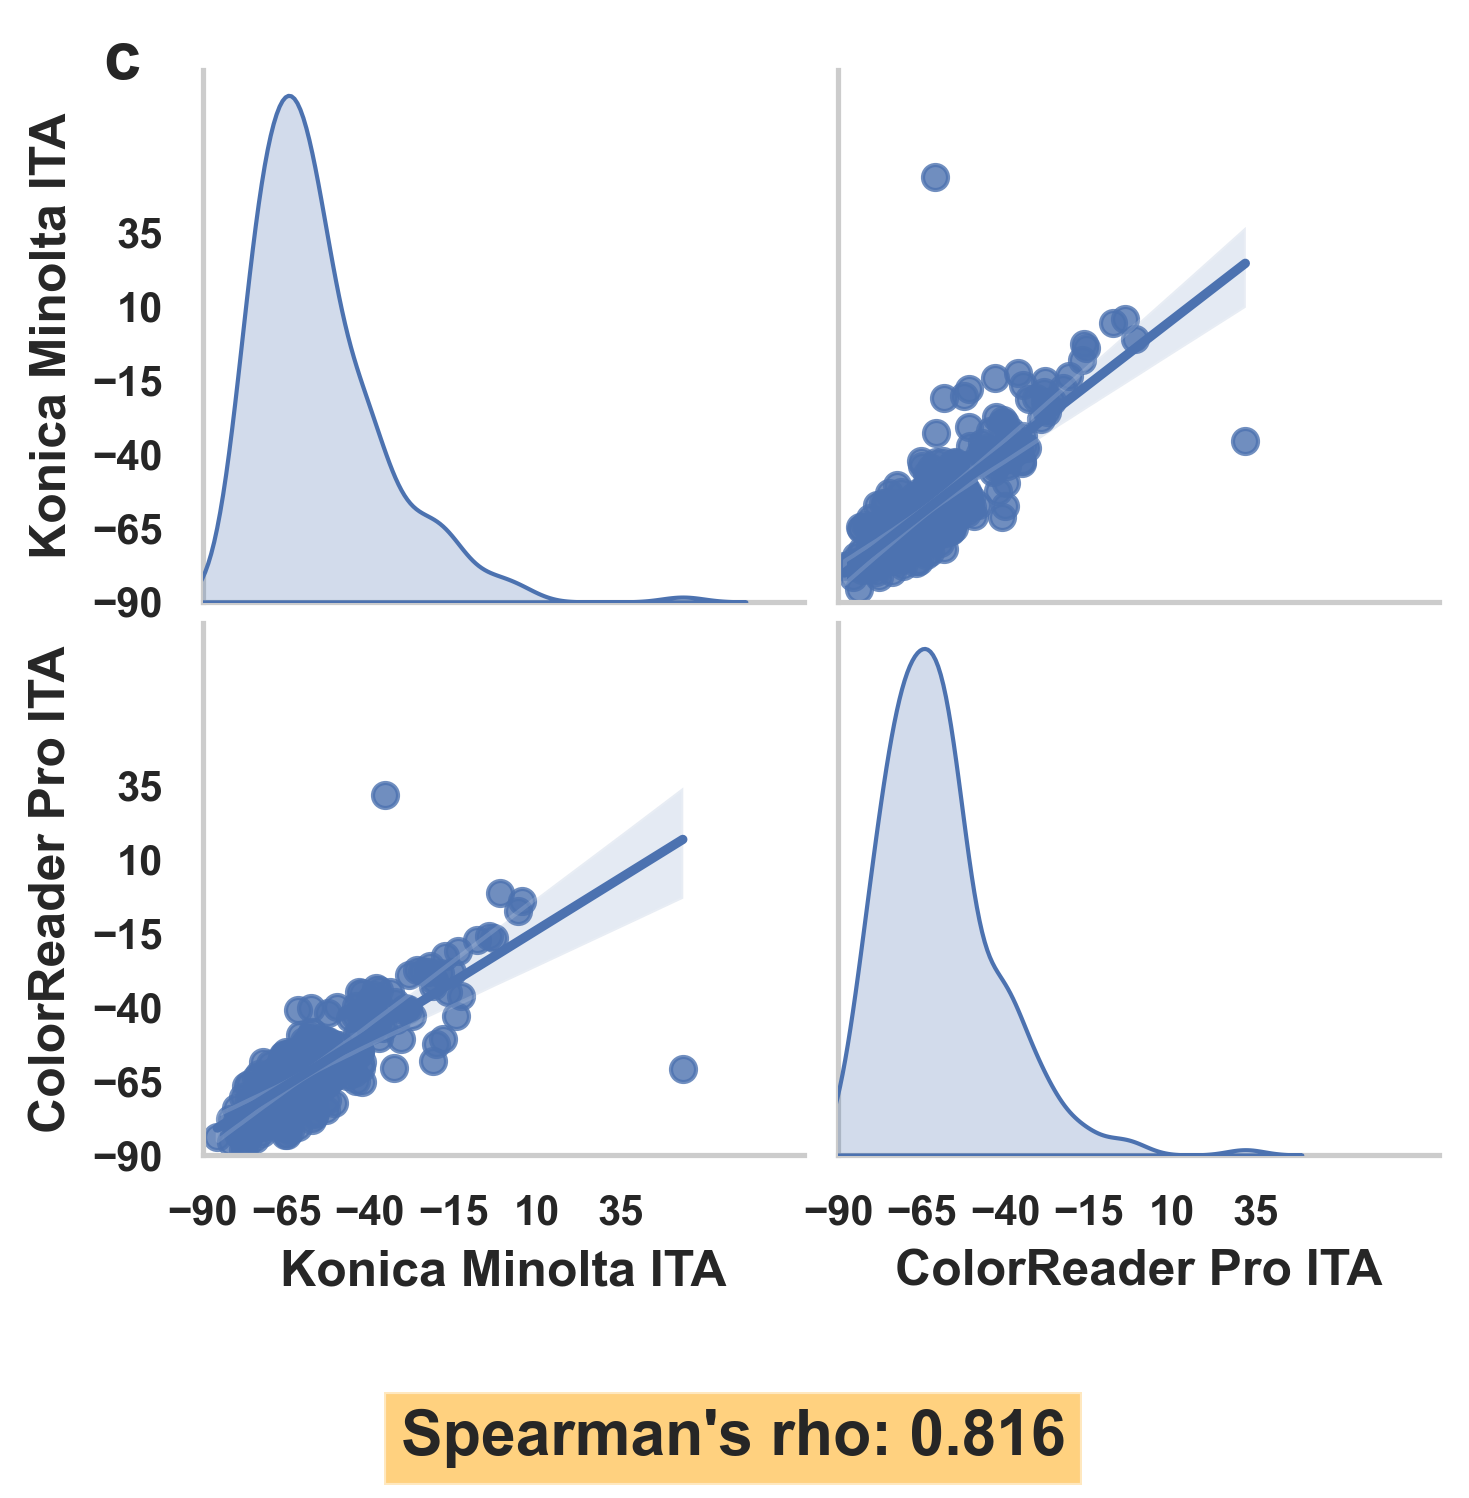
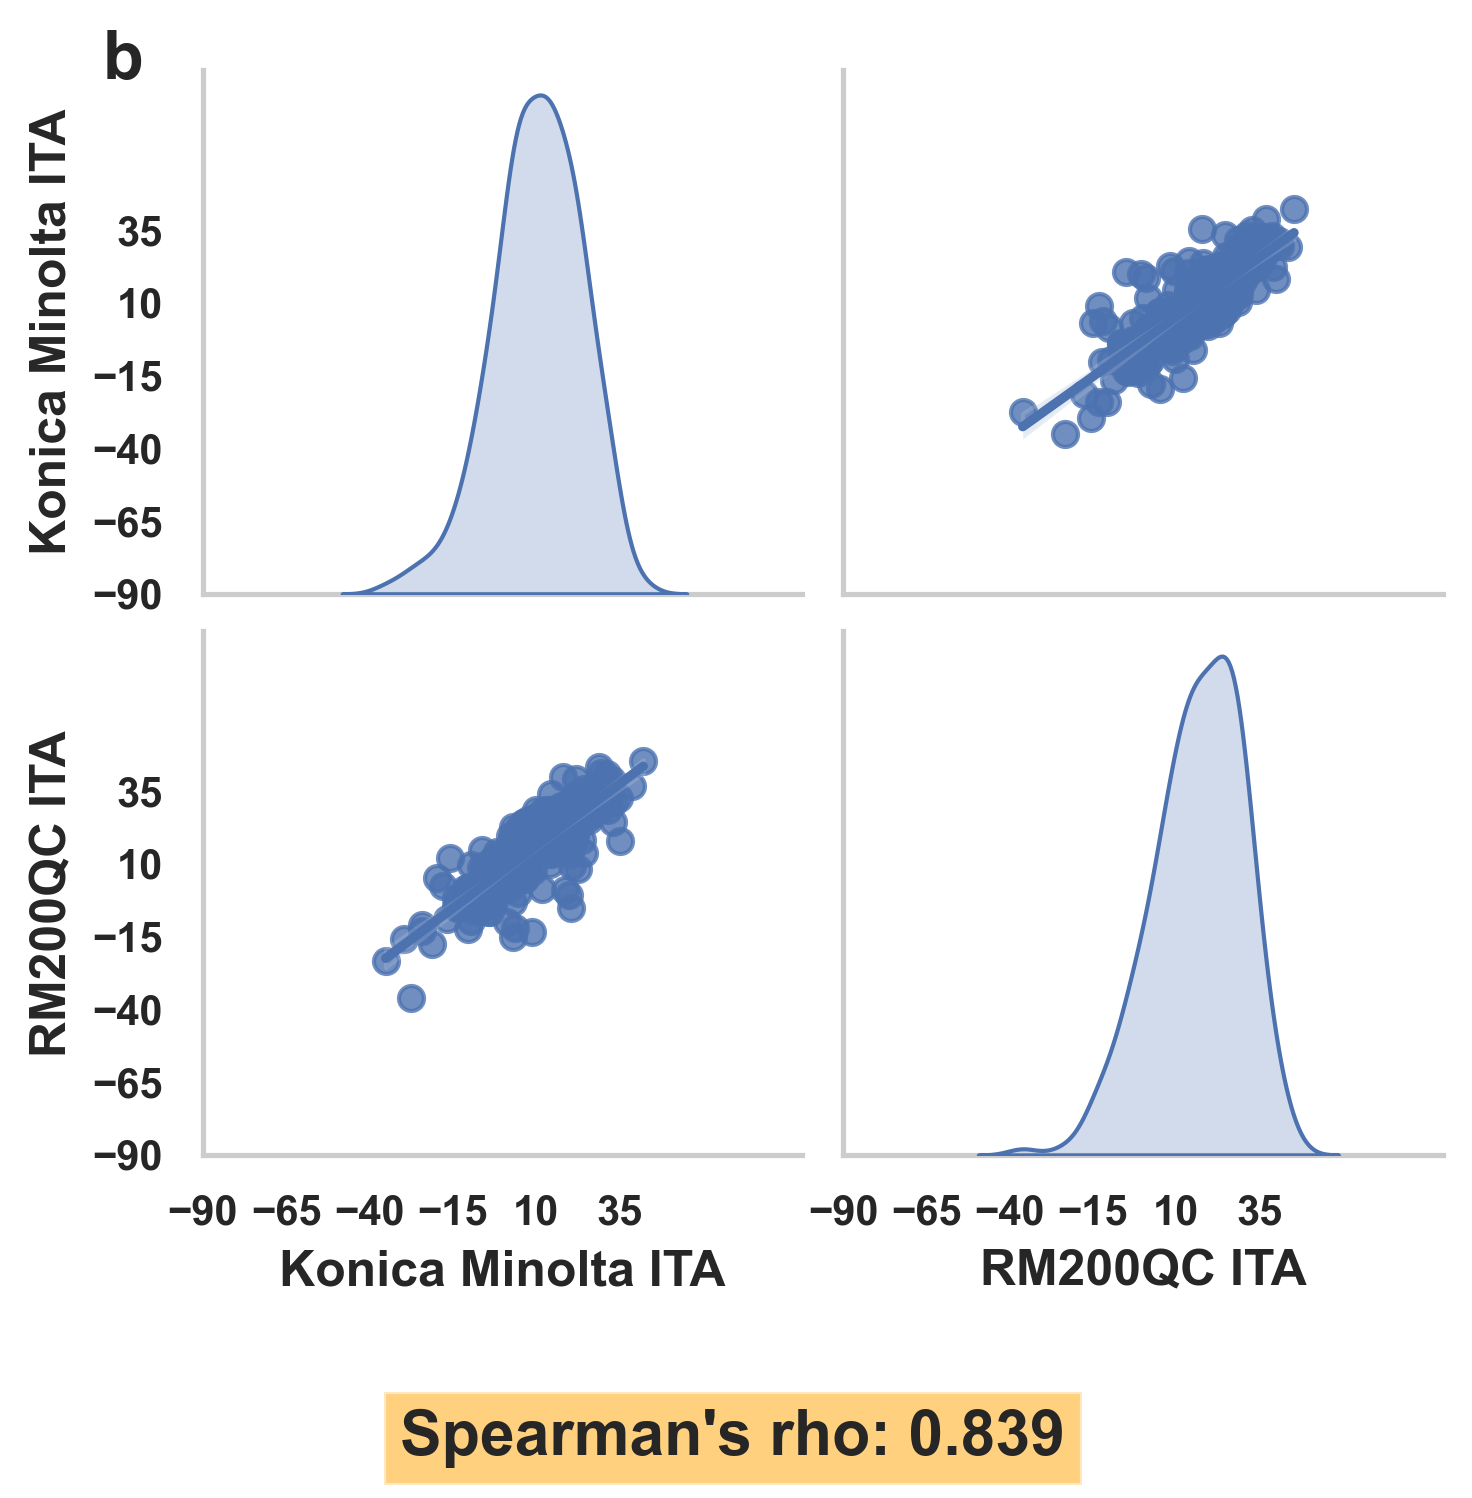
Pairplot for Fingernail (A)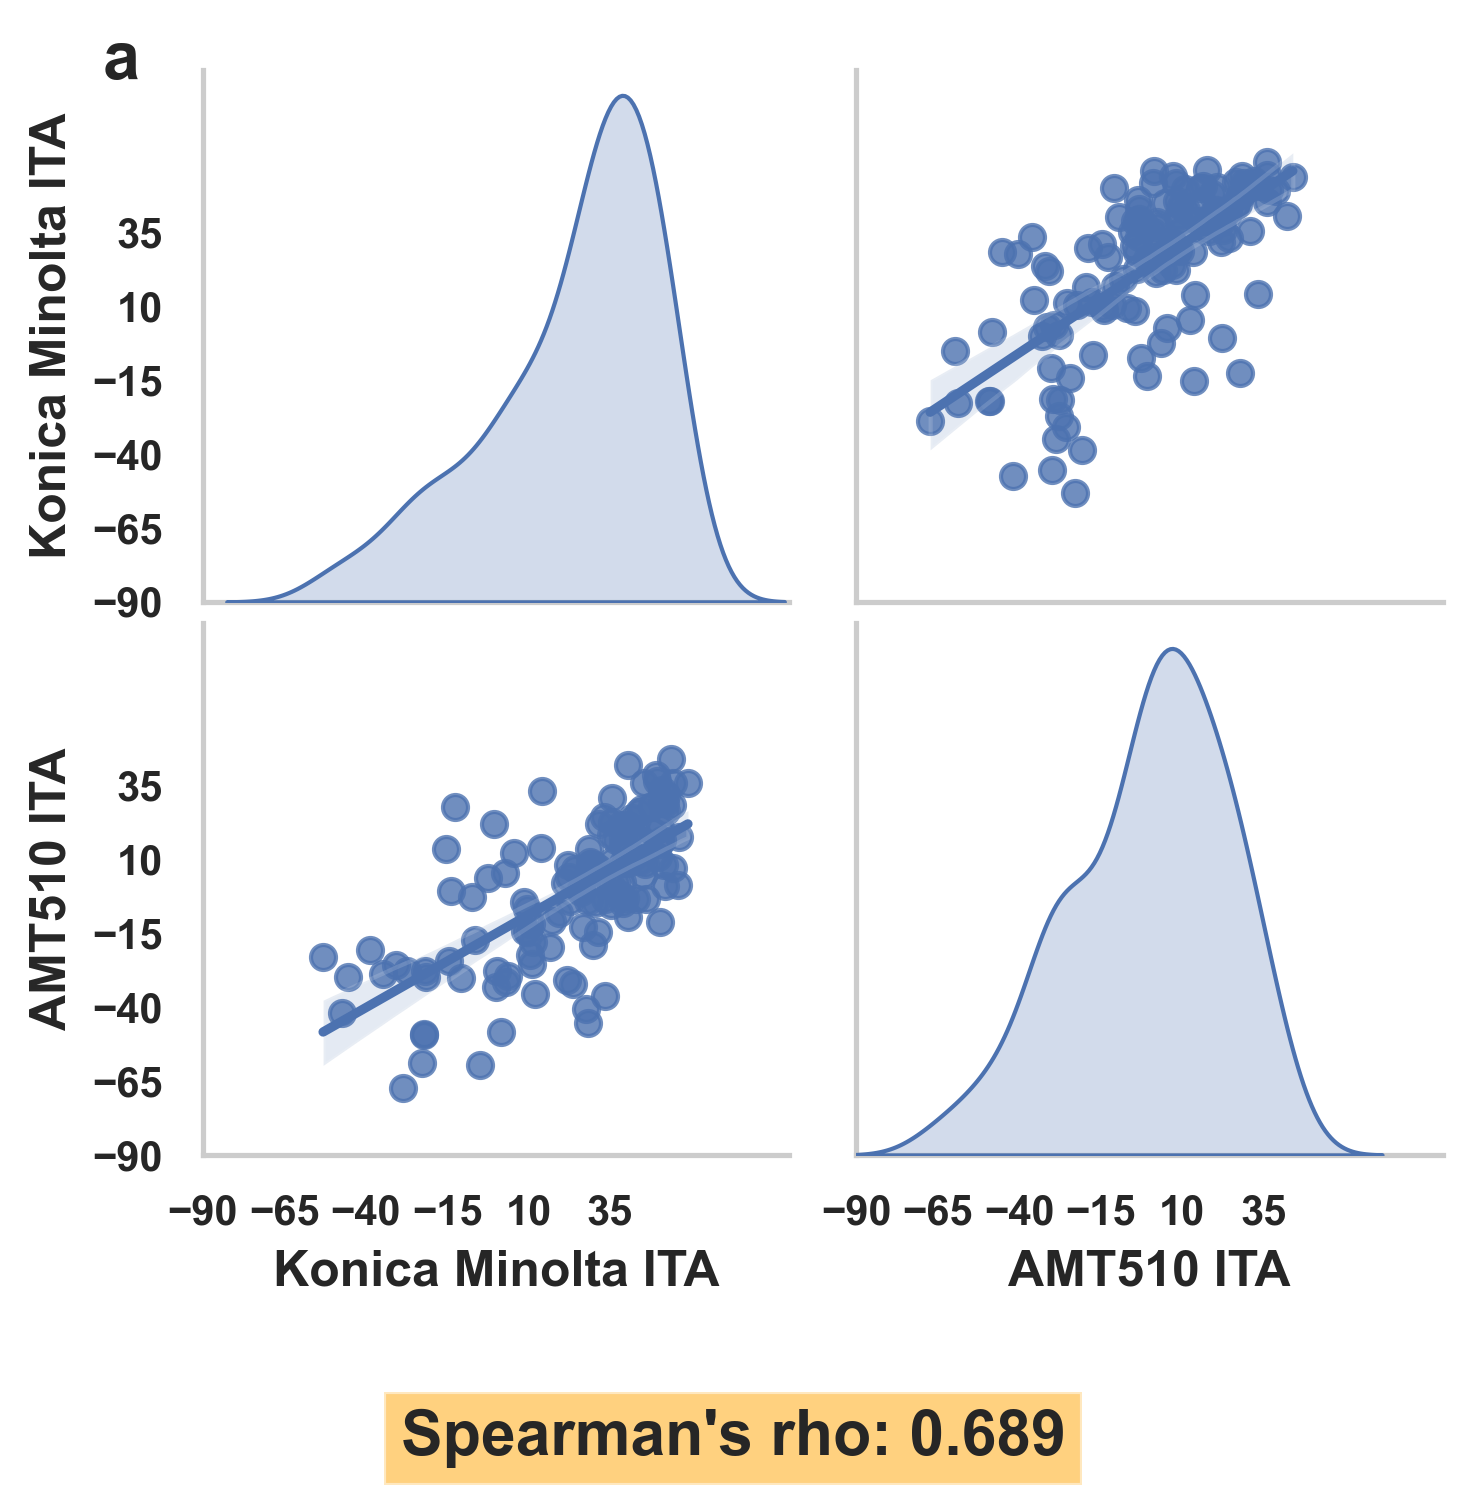
Pairplot for Forehead (F)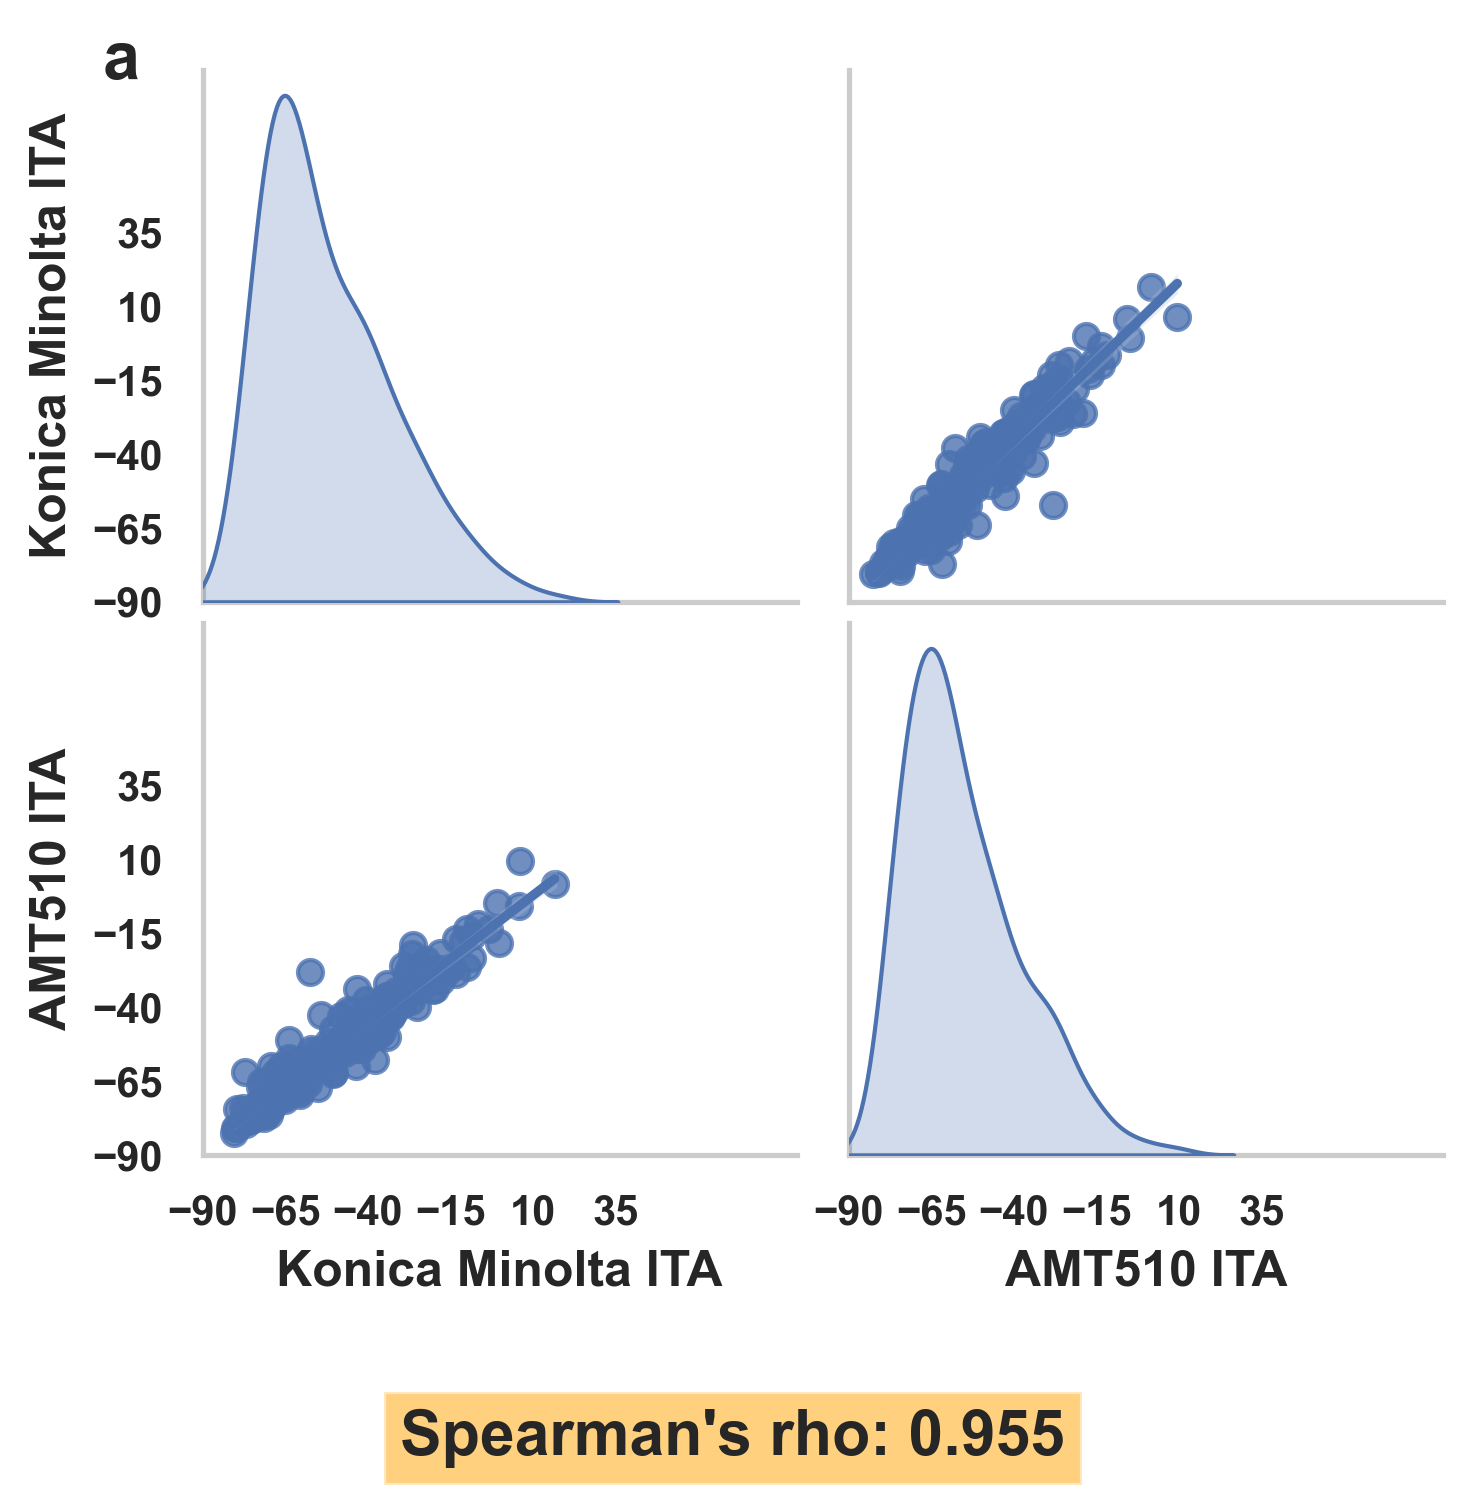
Pairplot for Inner Upper Arm (E)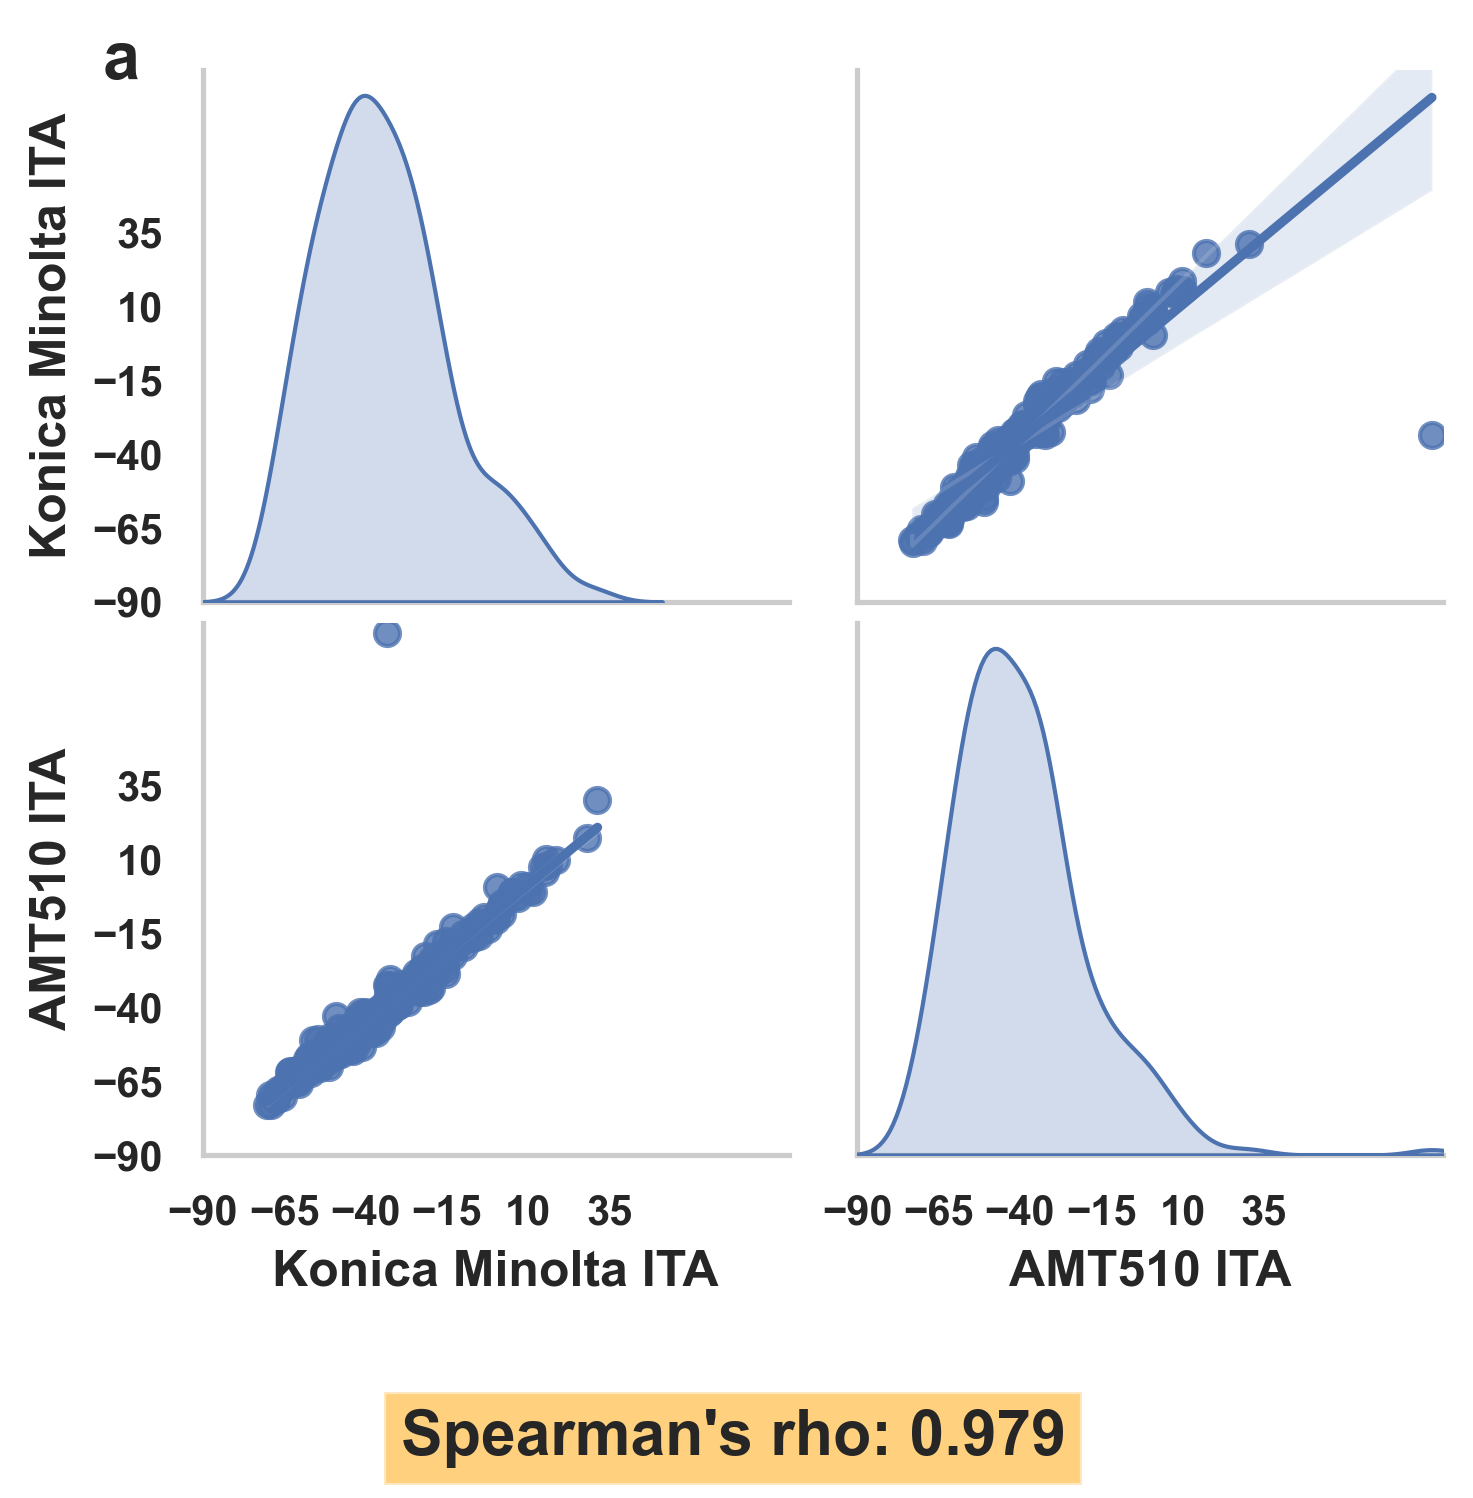
Pairplot for Palmar - Opposite DIP (D)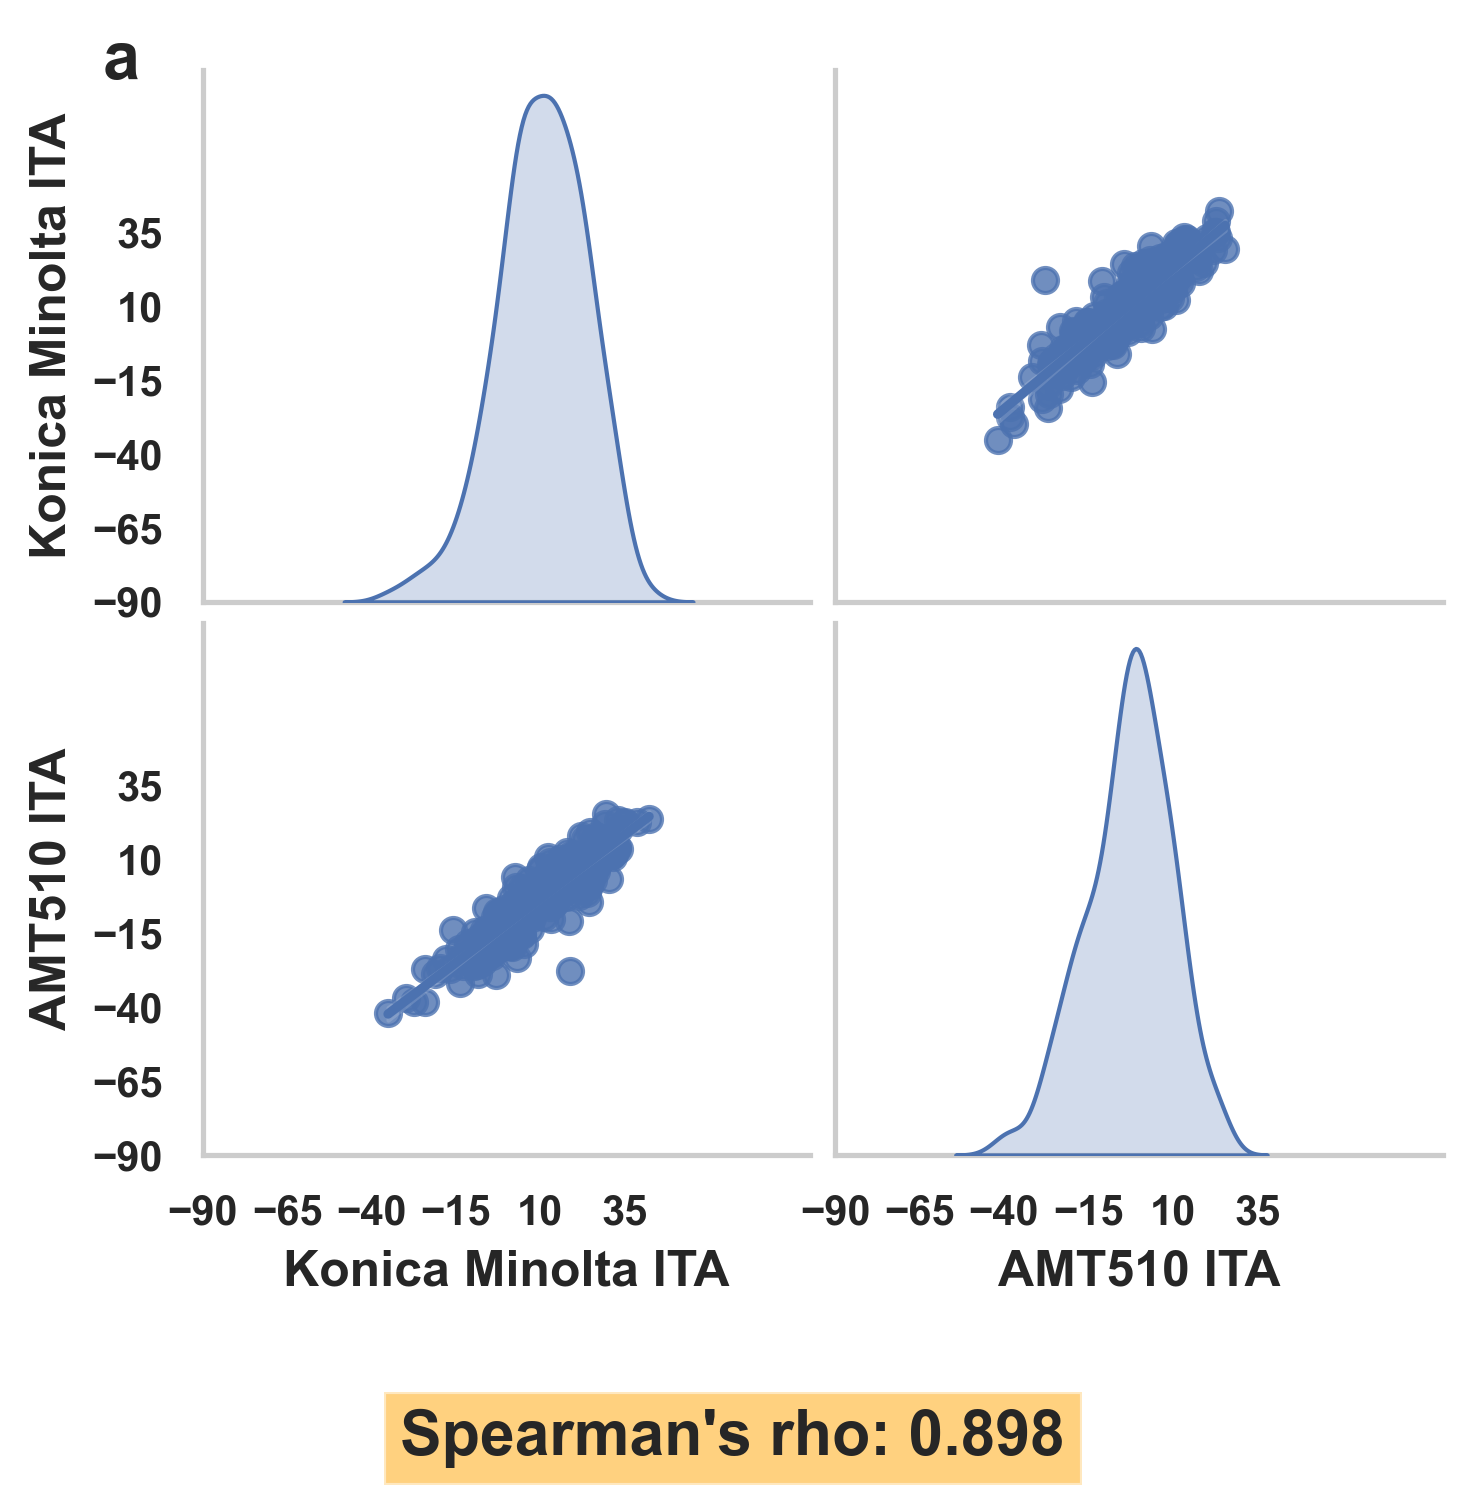
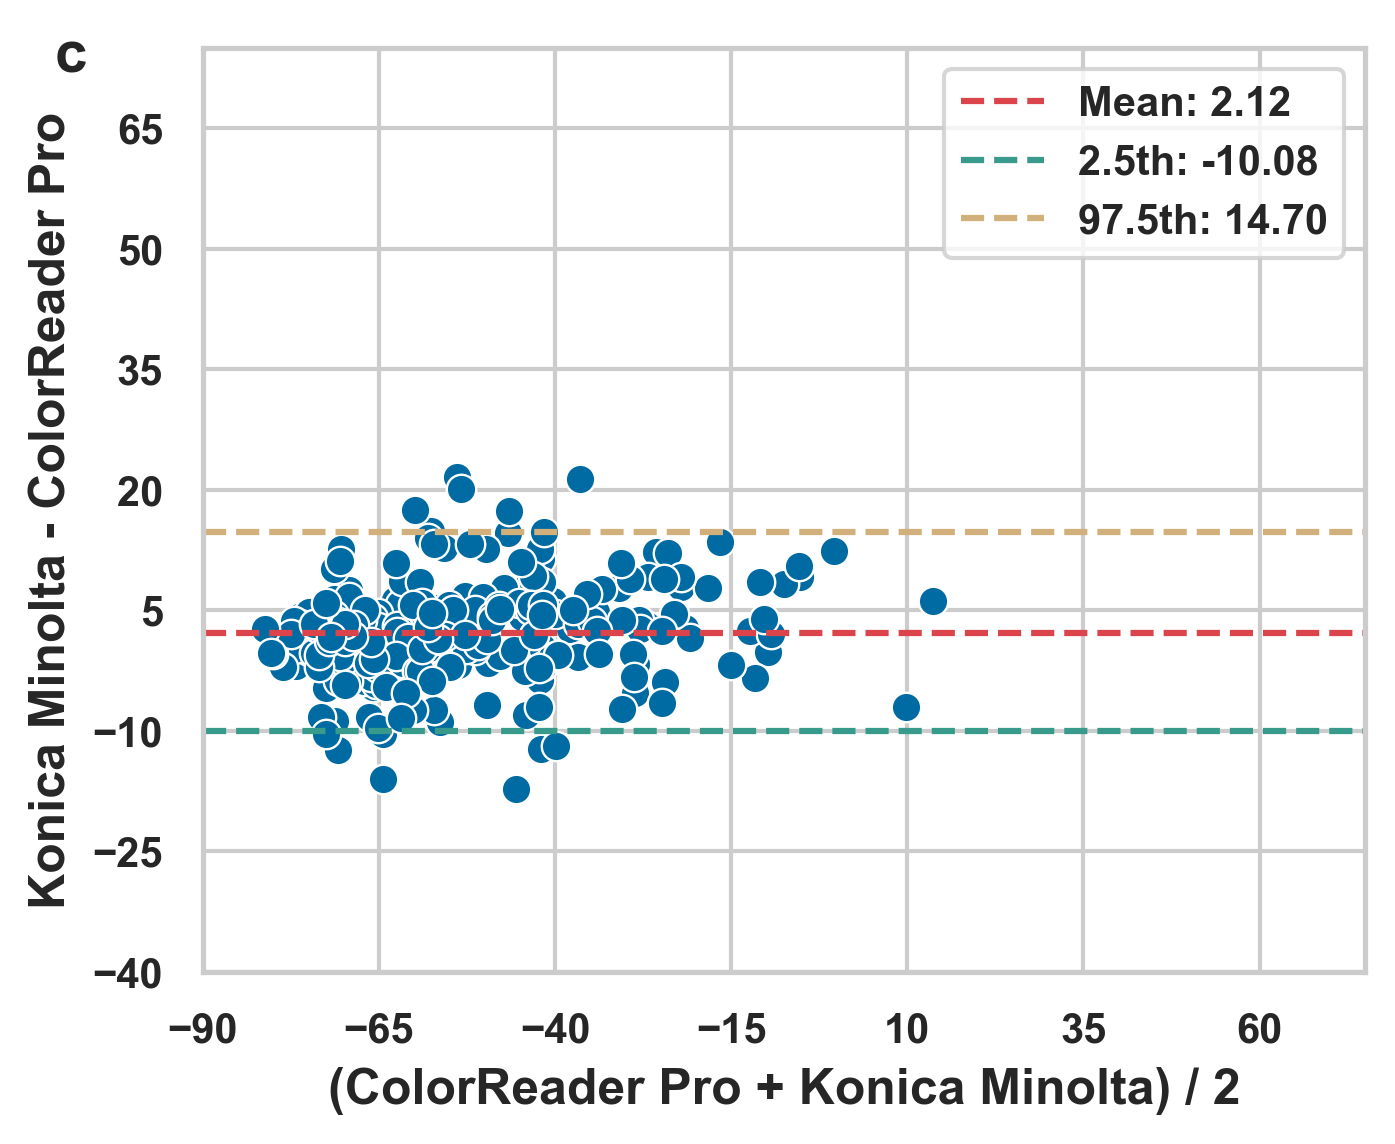
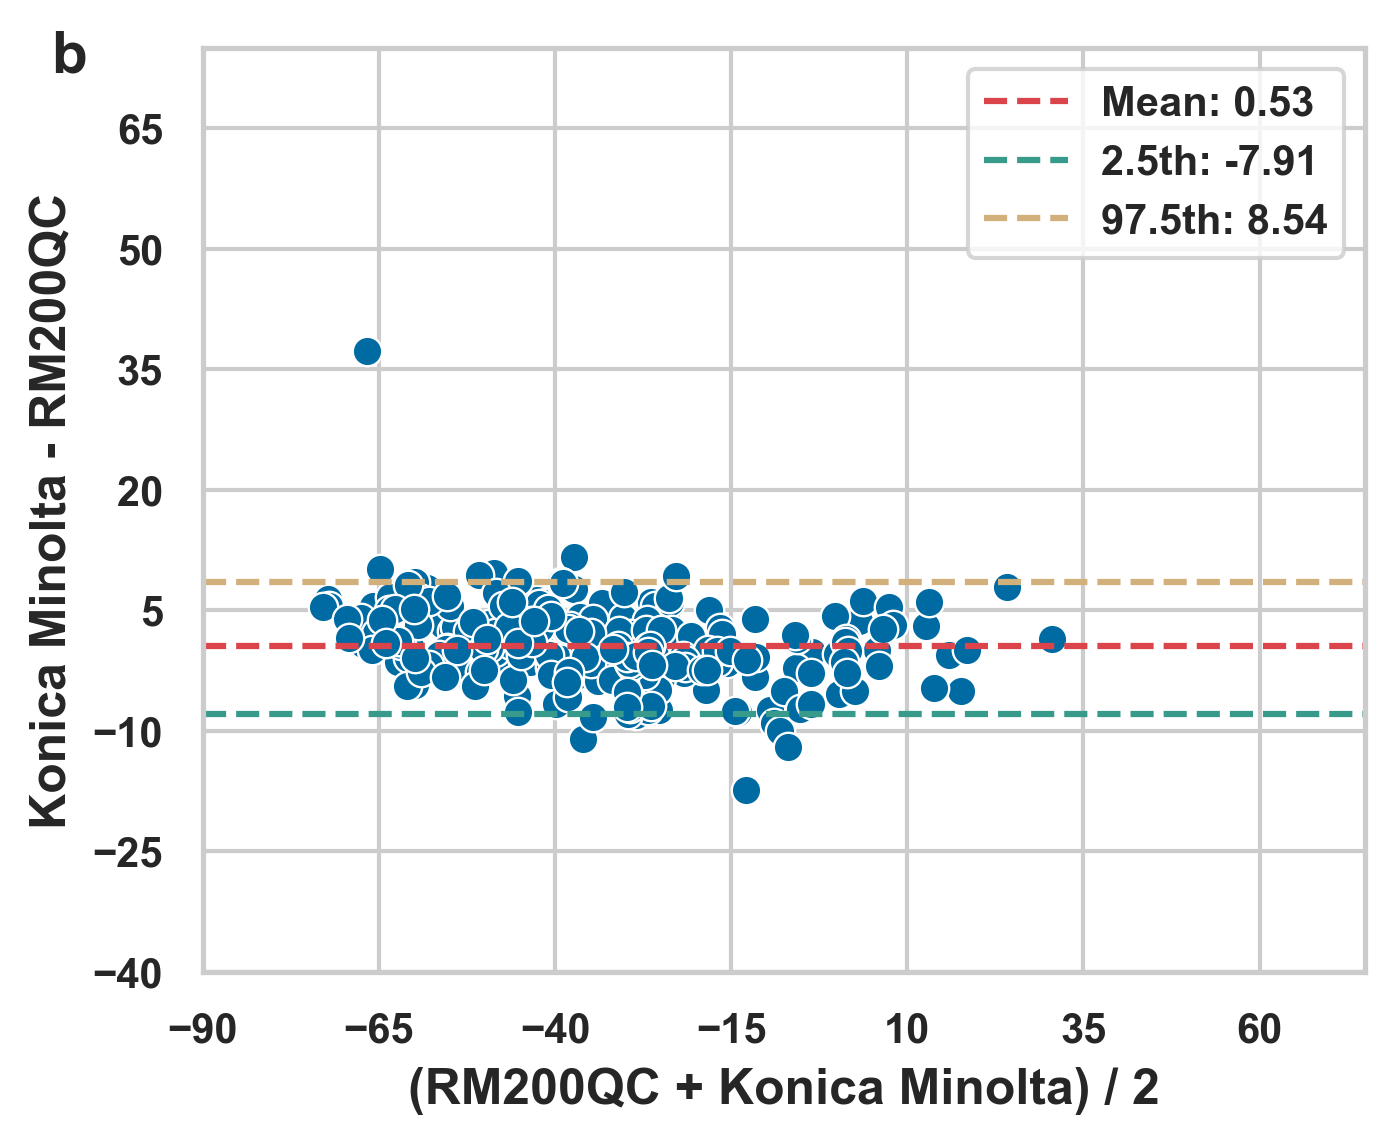
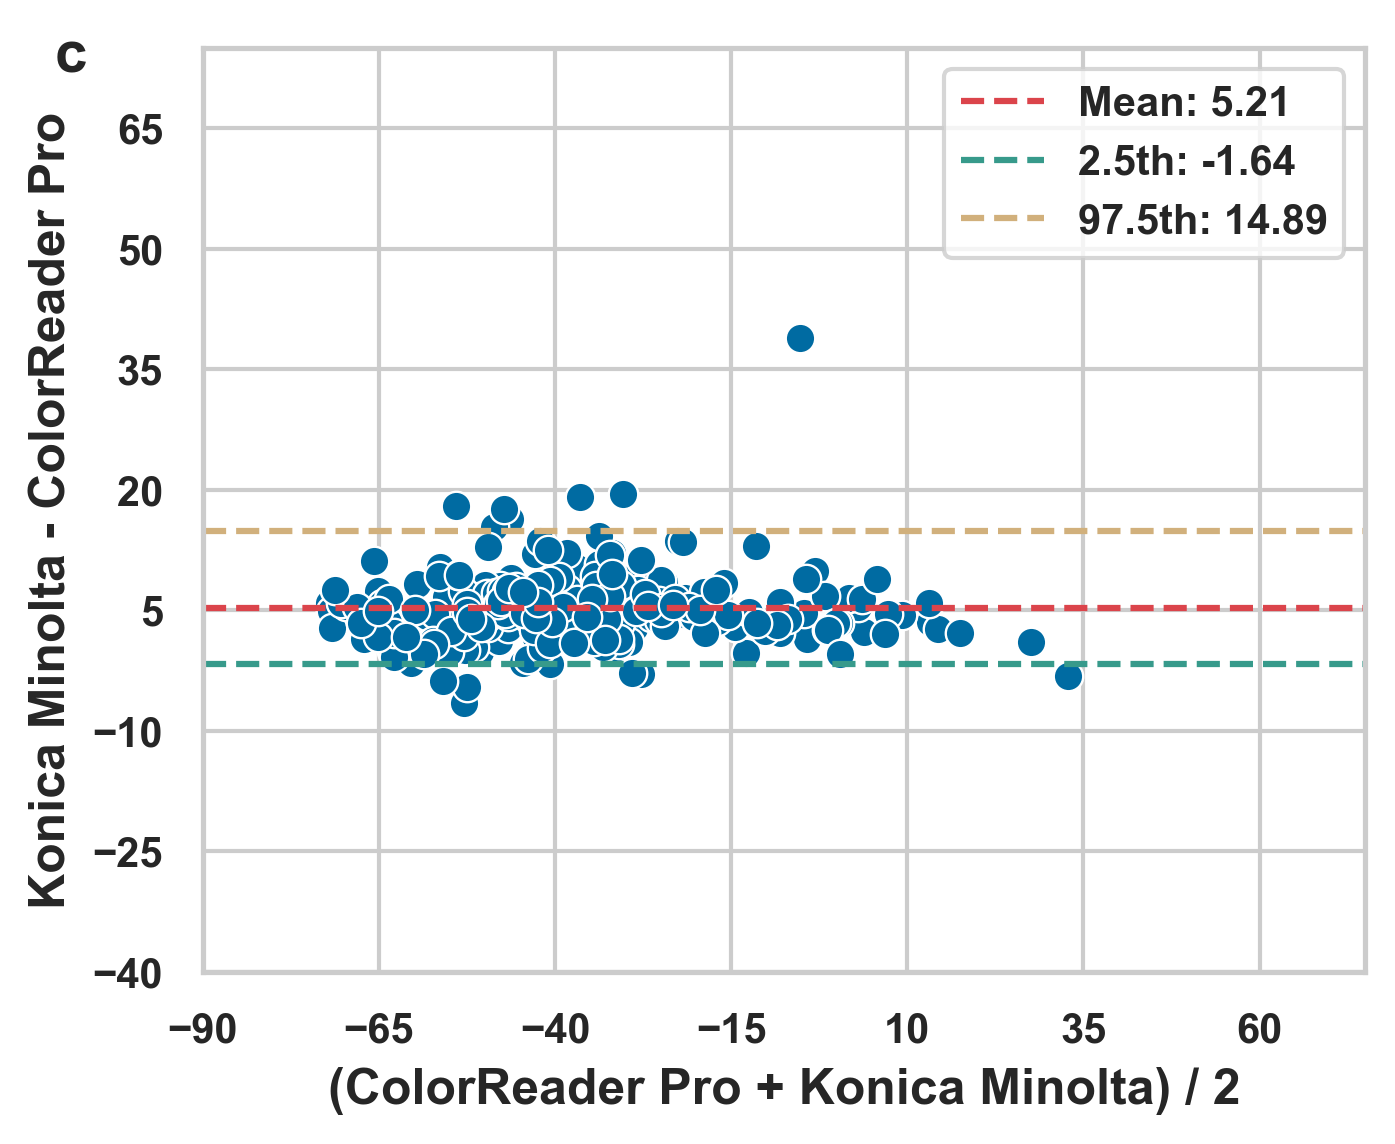
Bland Altman plot for Back of Hand (C)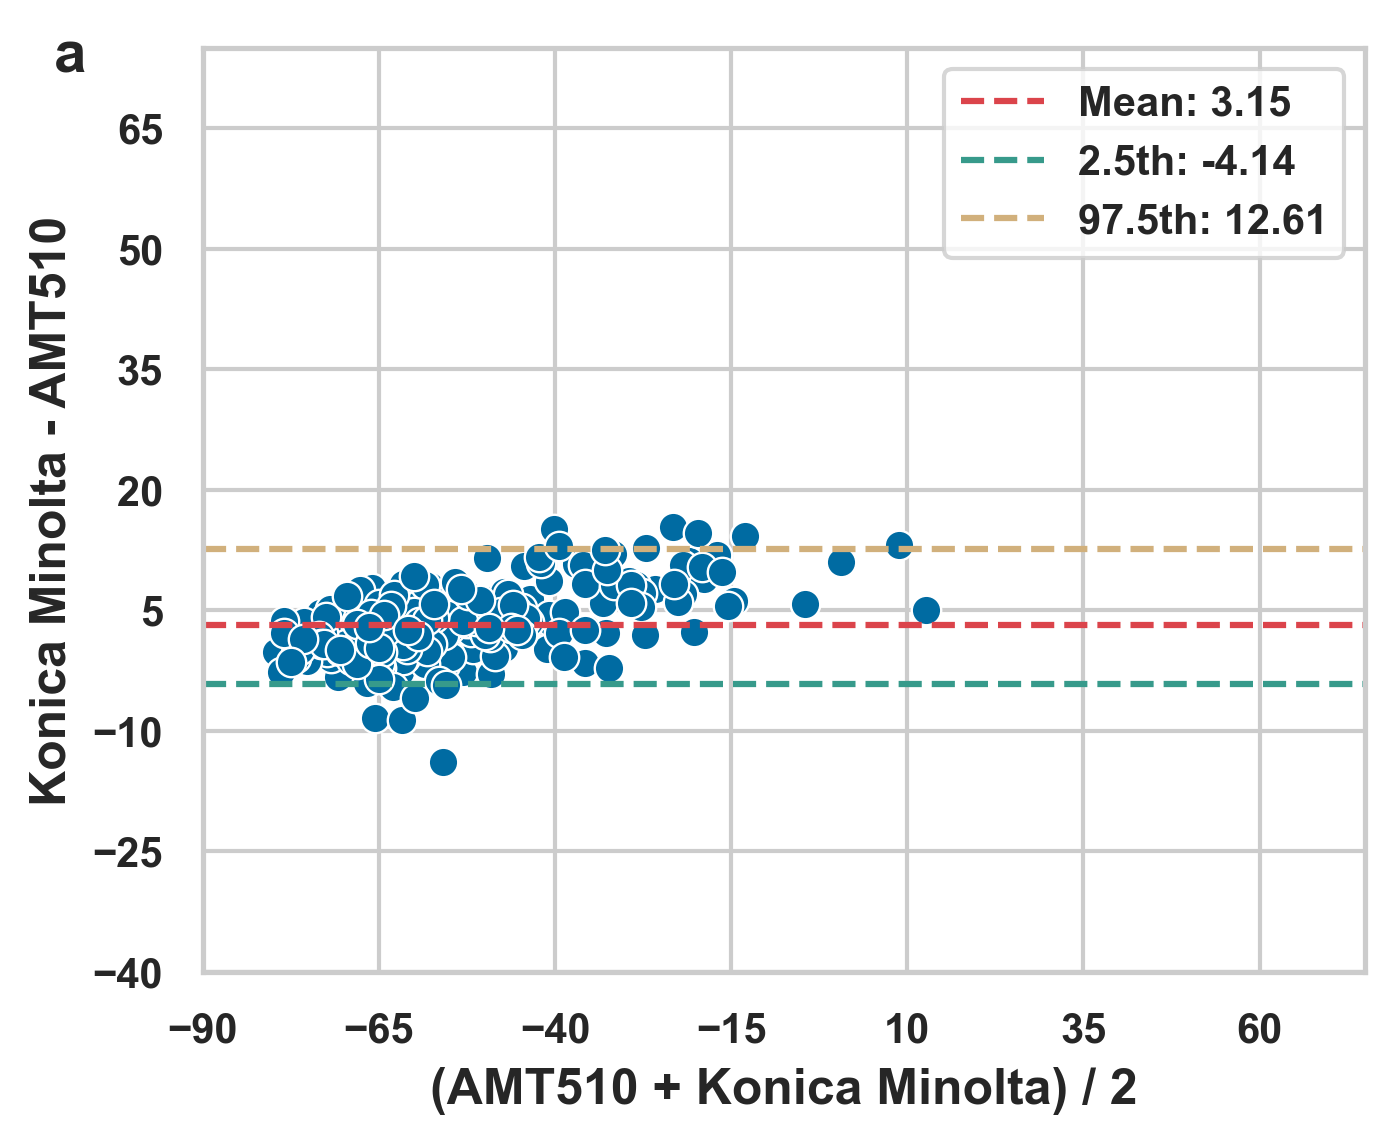
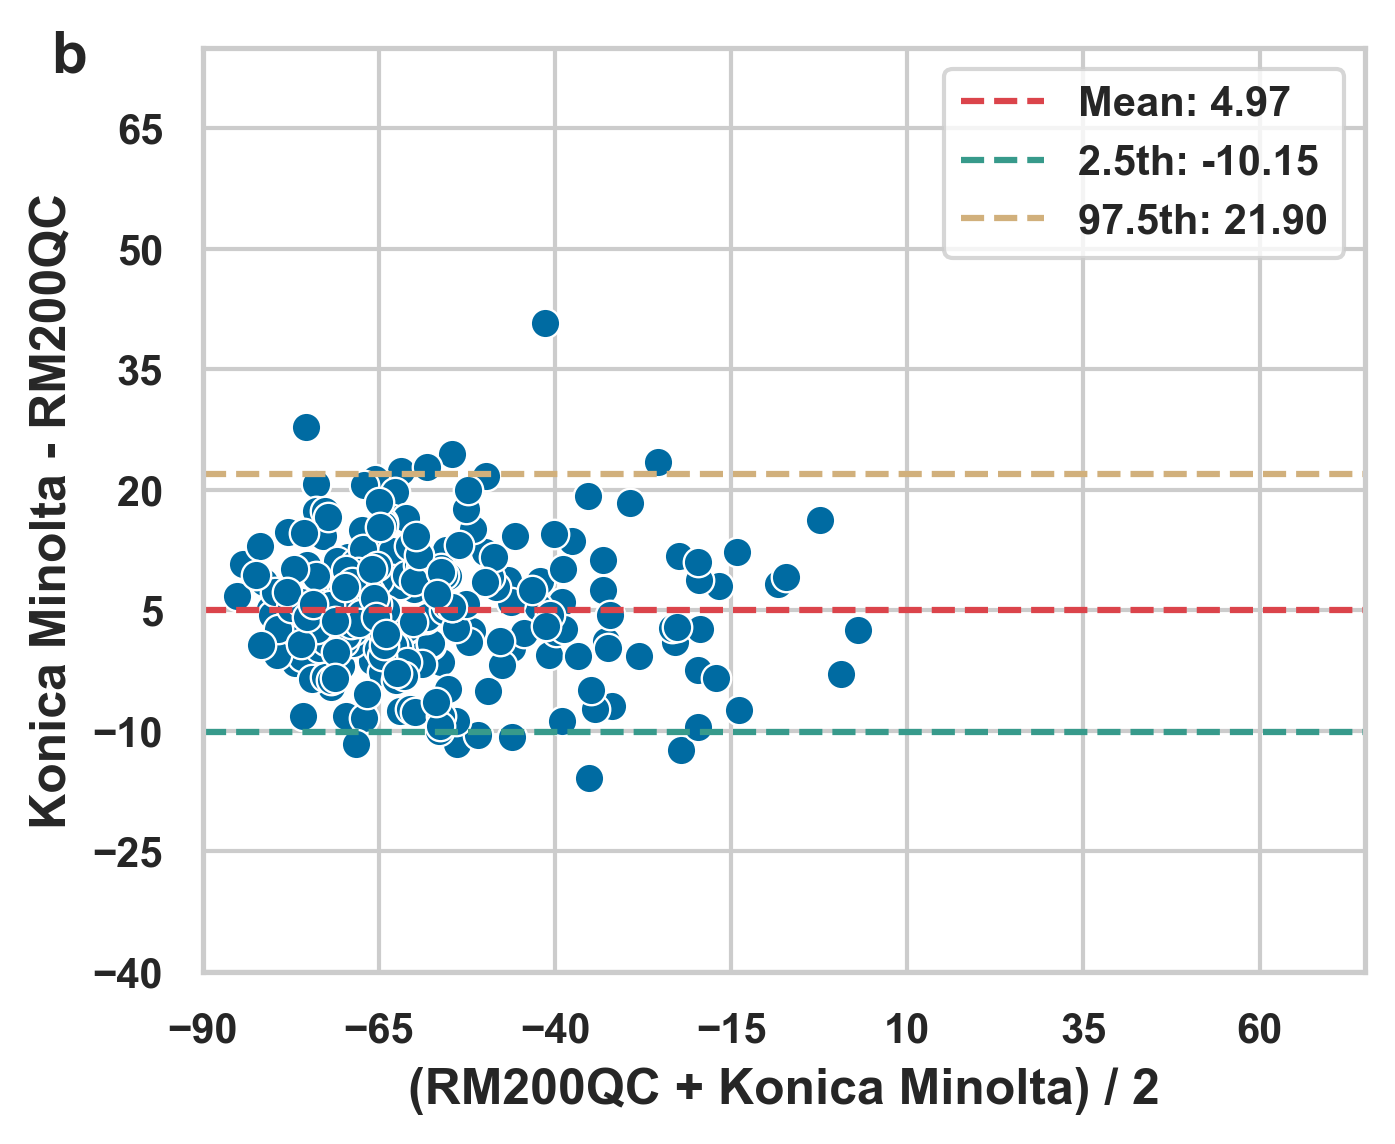
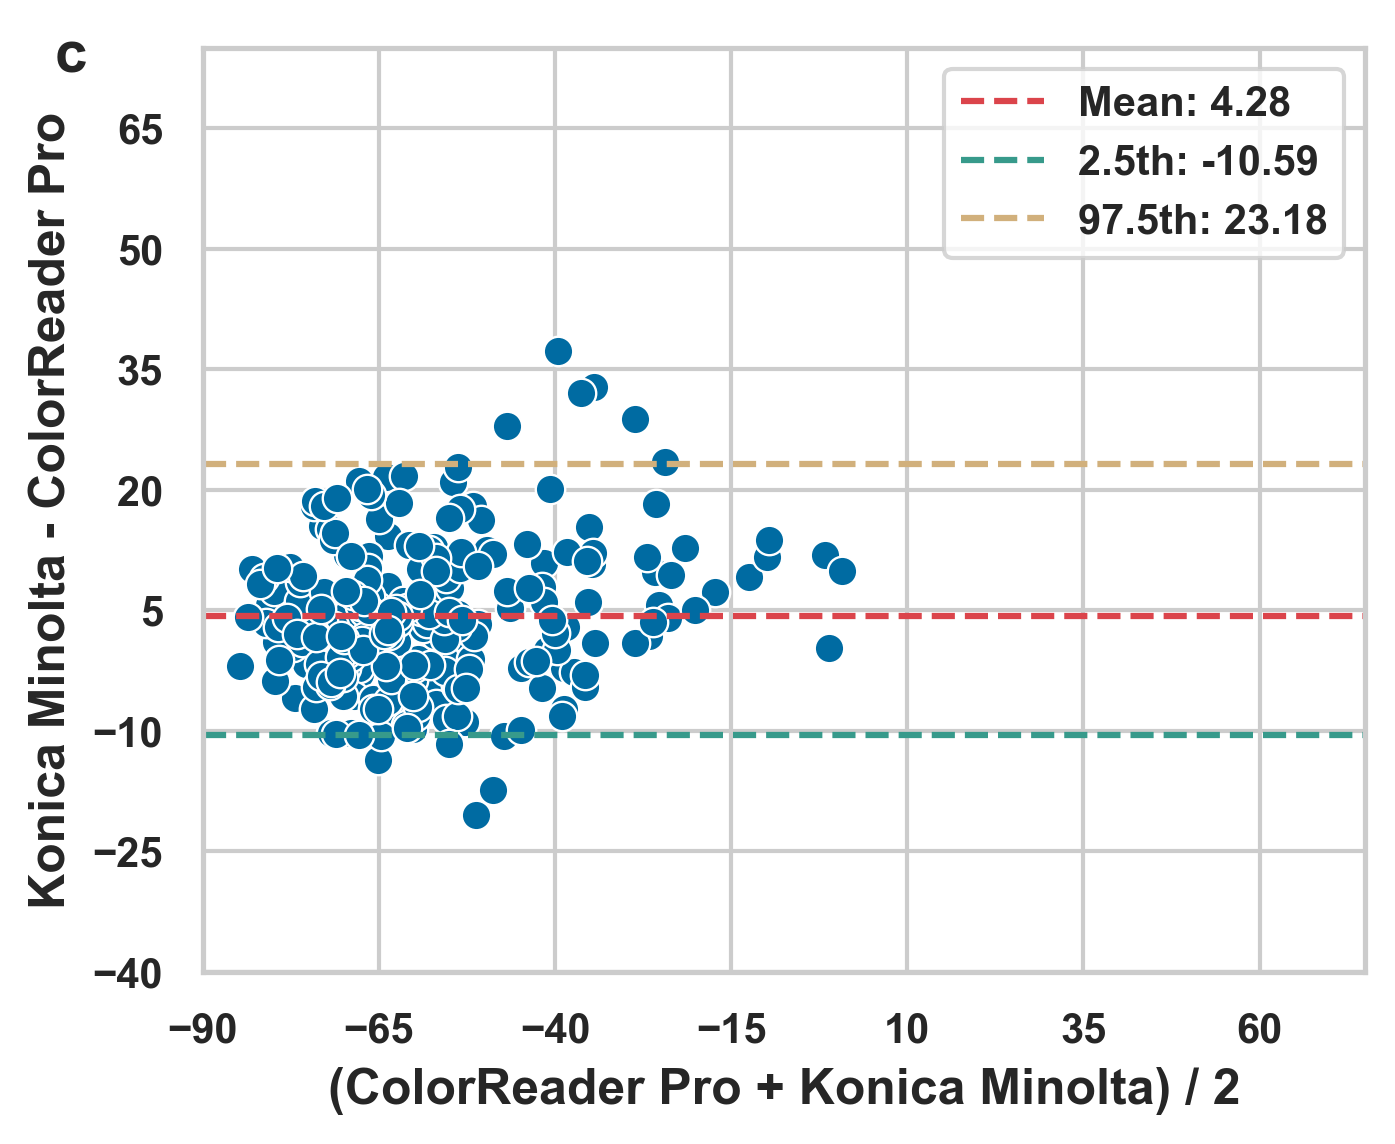
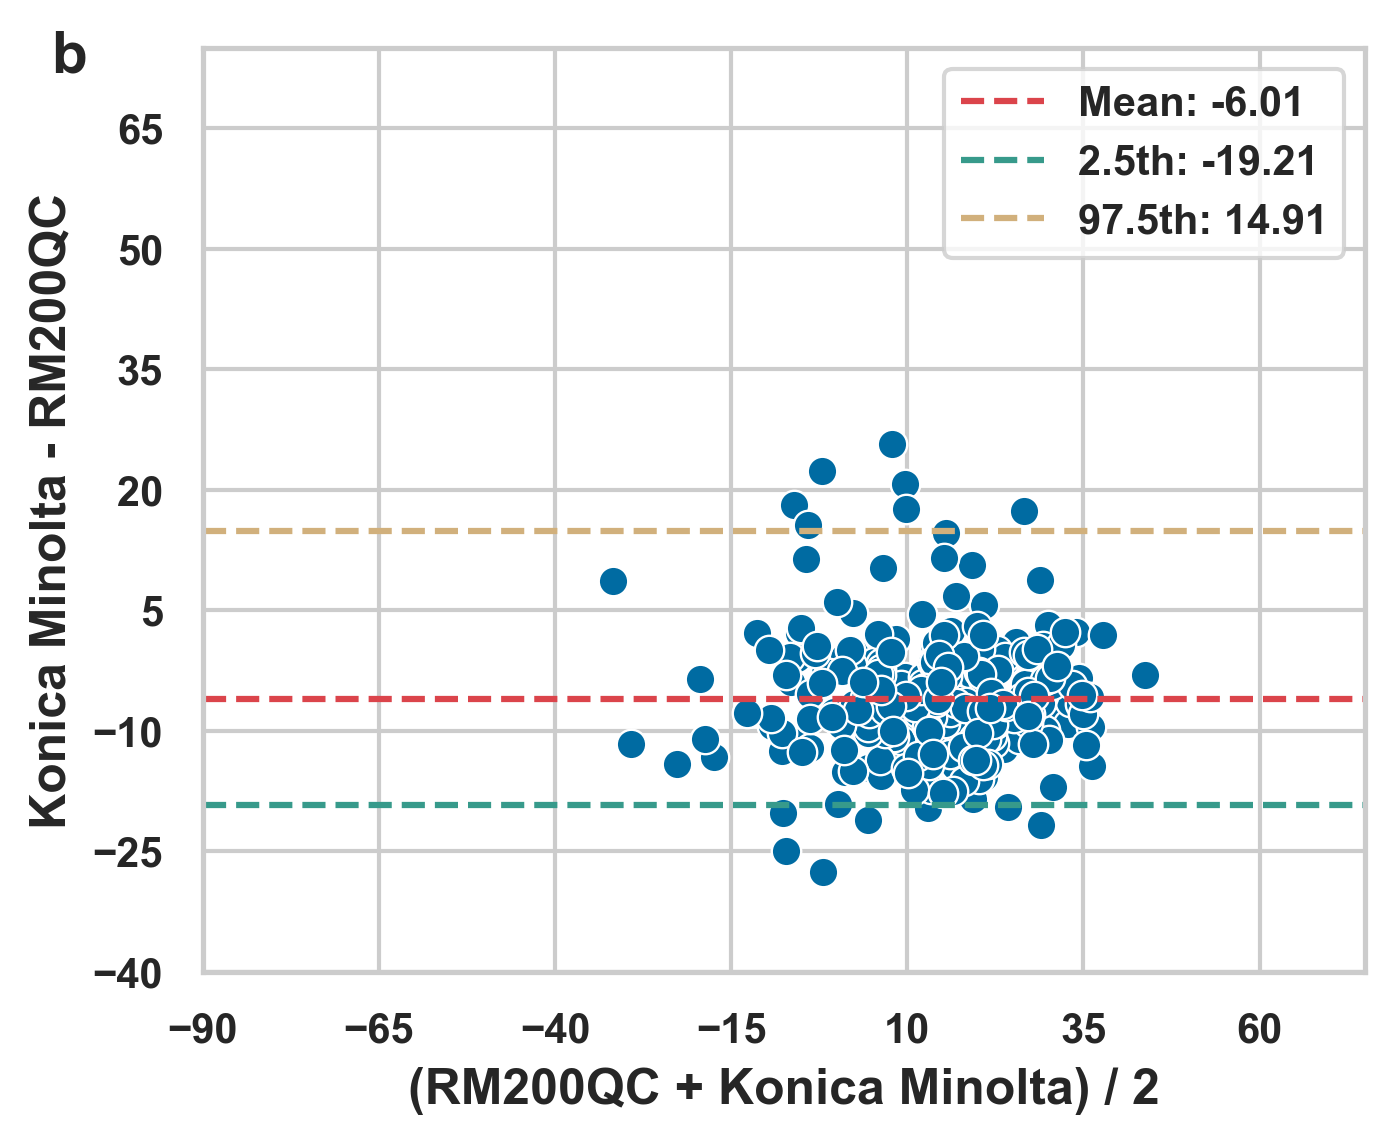
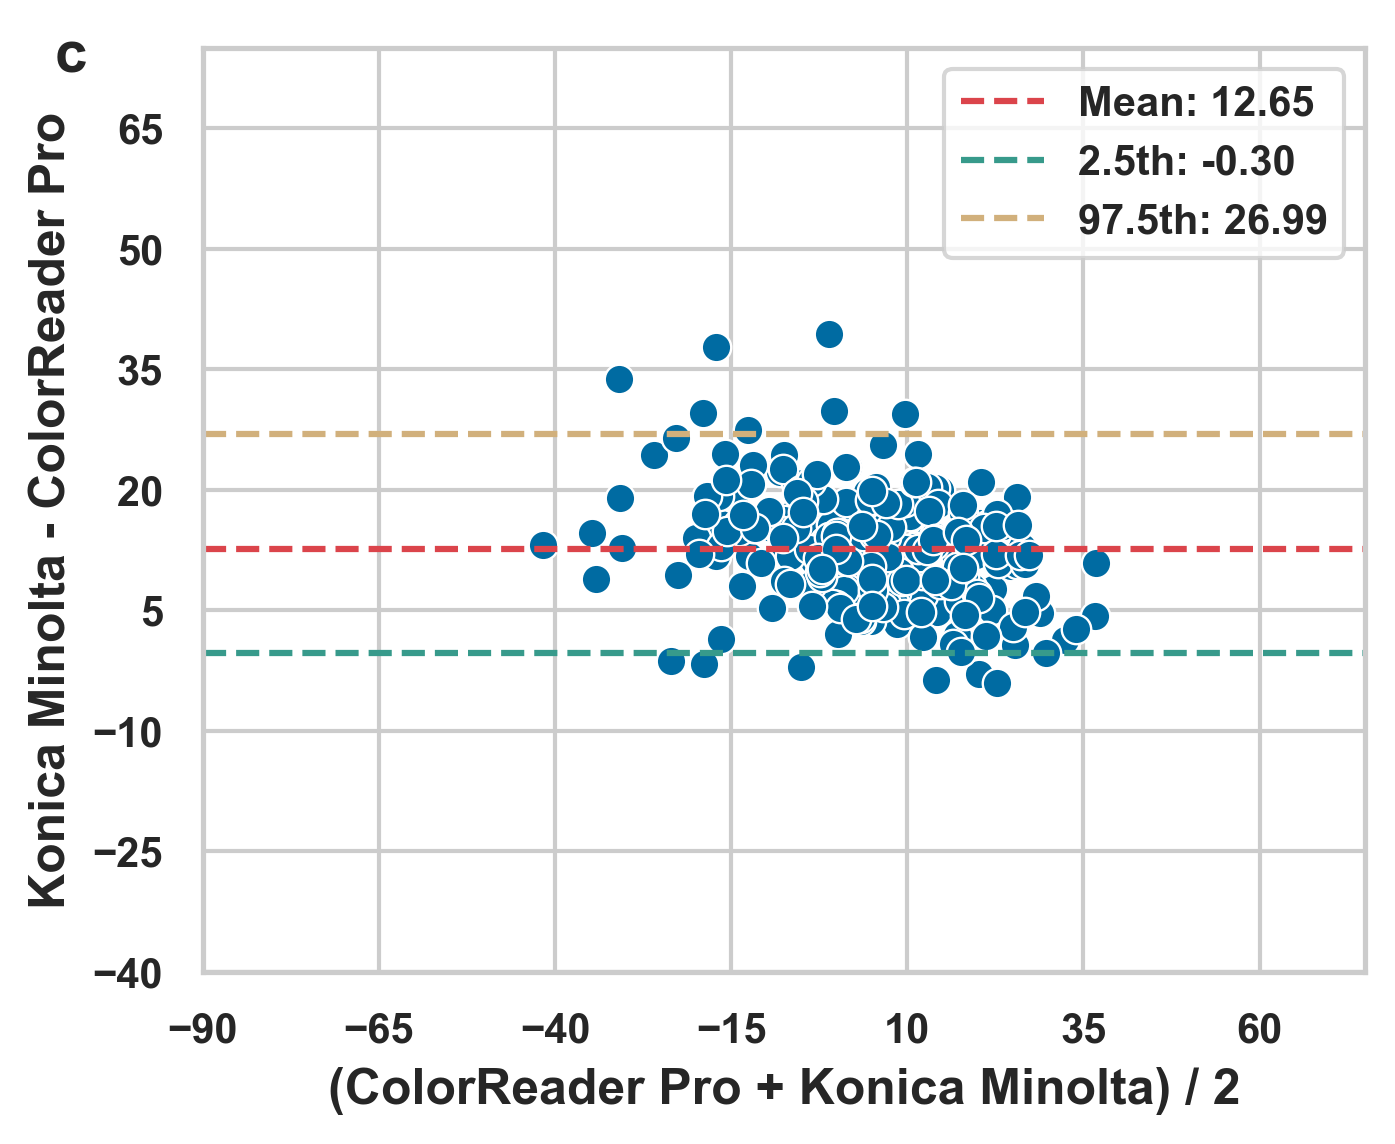
Bland Altman plot for Dorsal - DIP (B)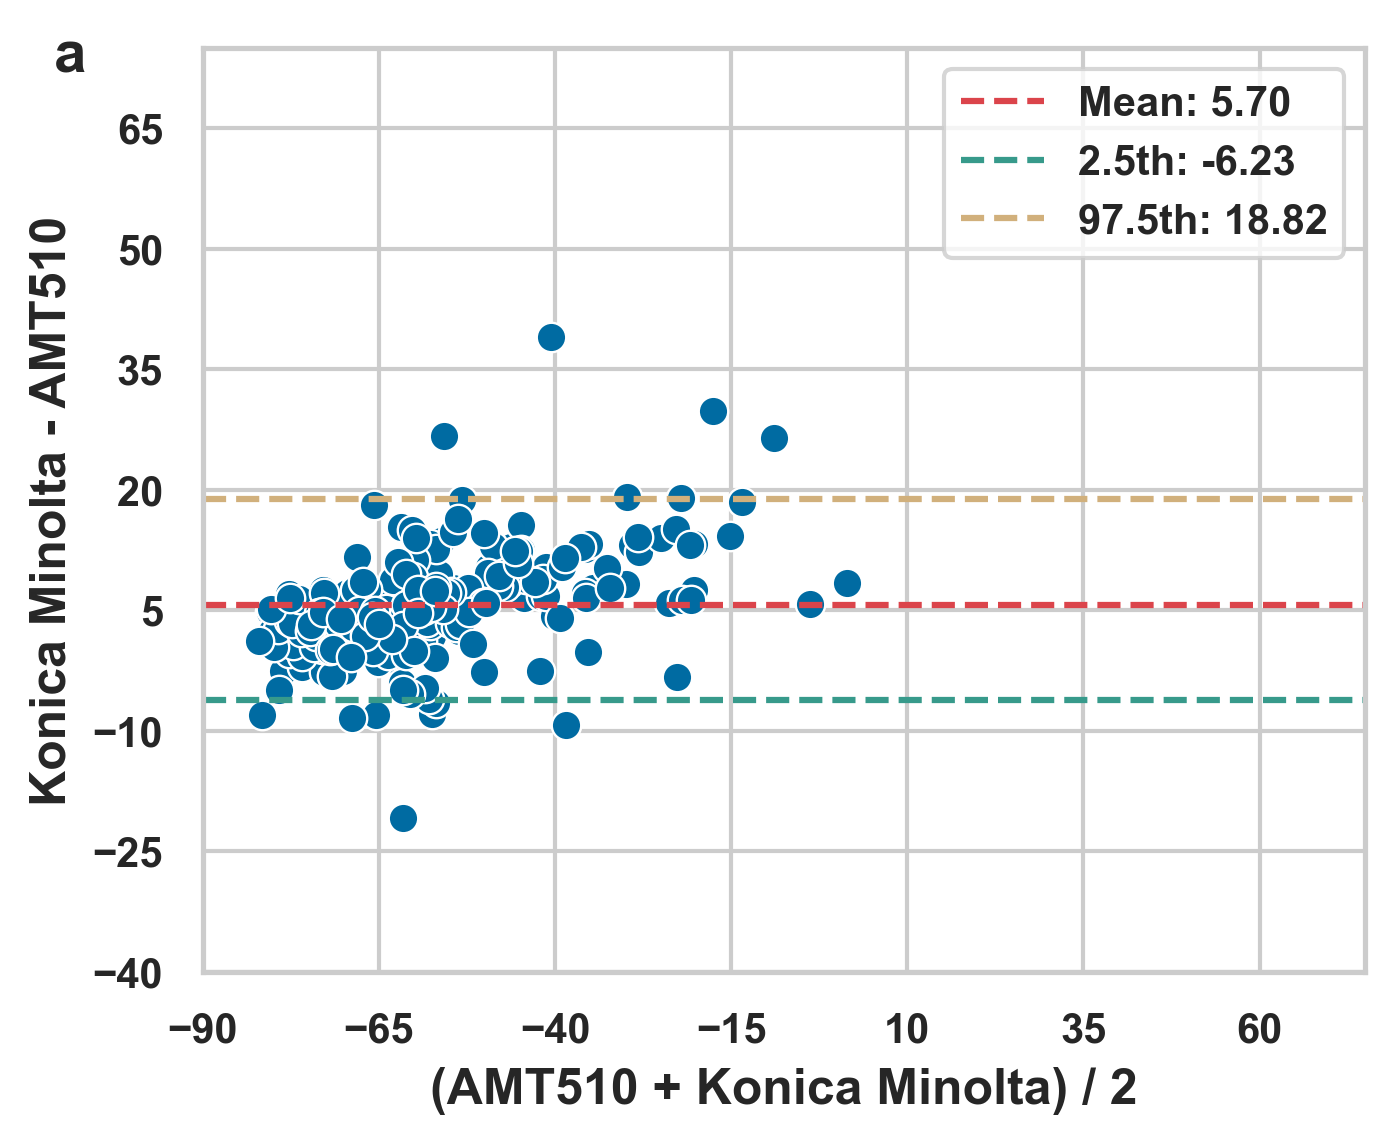
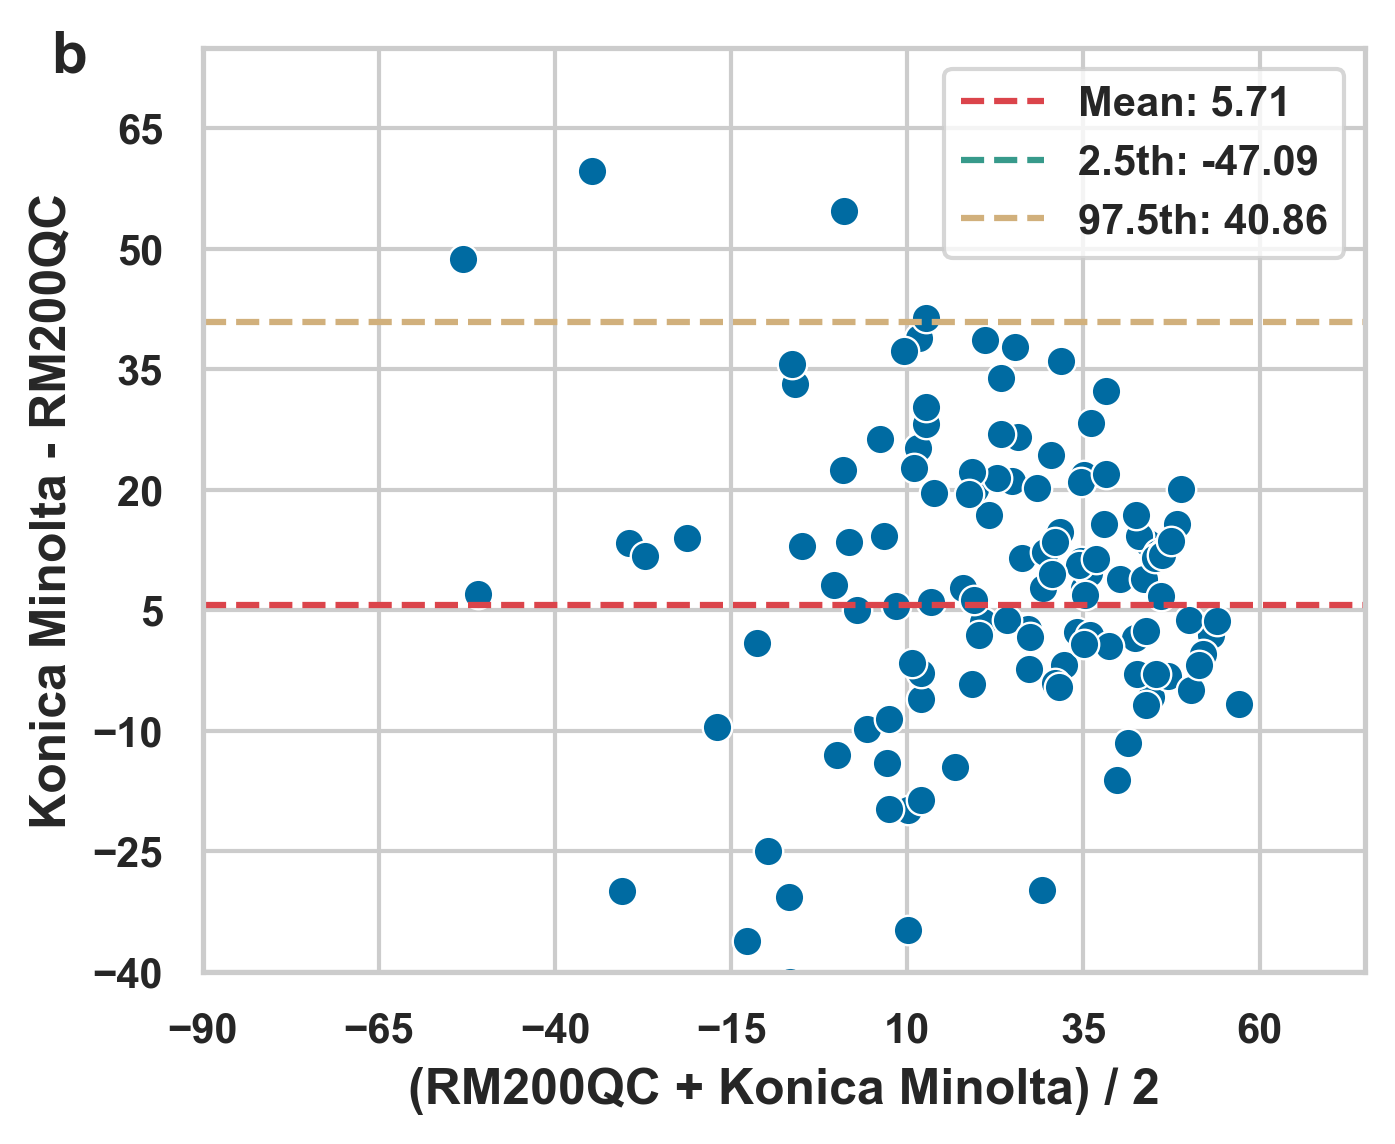
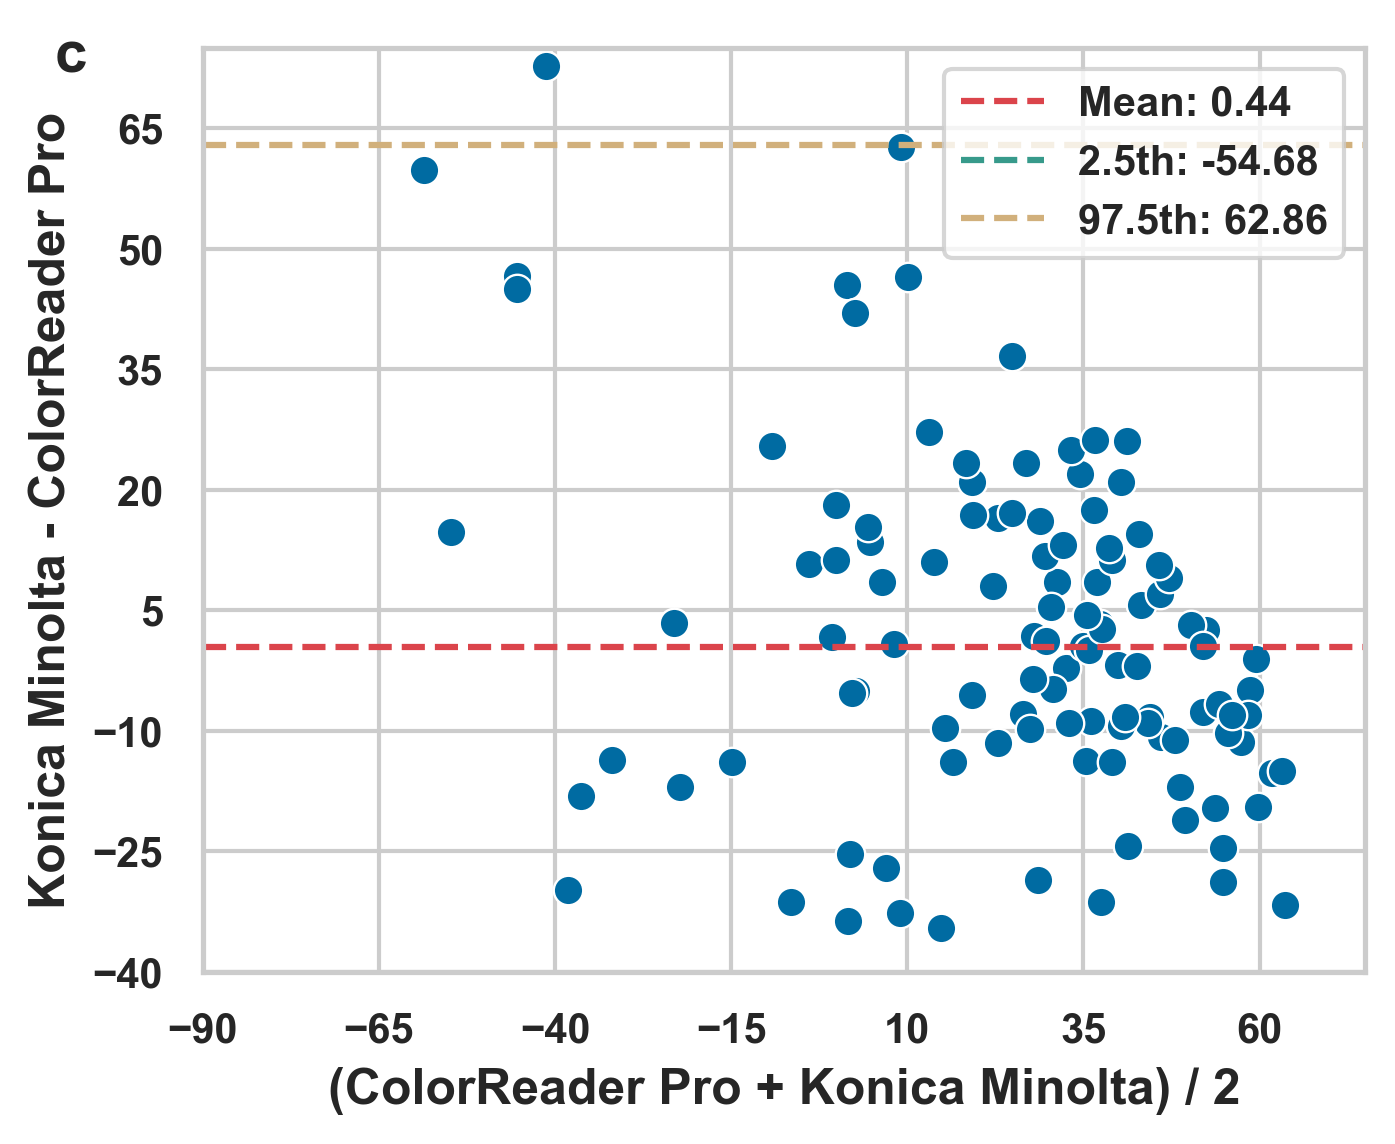
Bland Altman plot for Fingernail (A)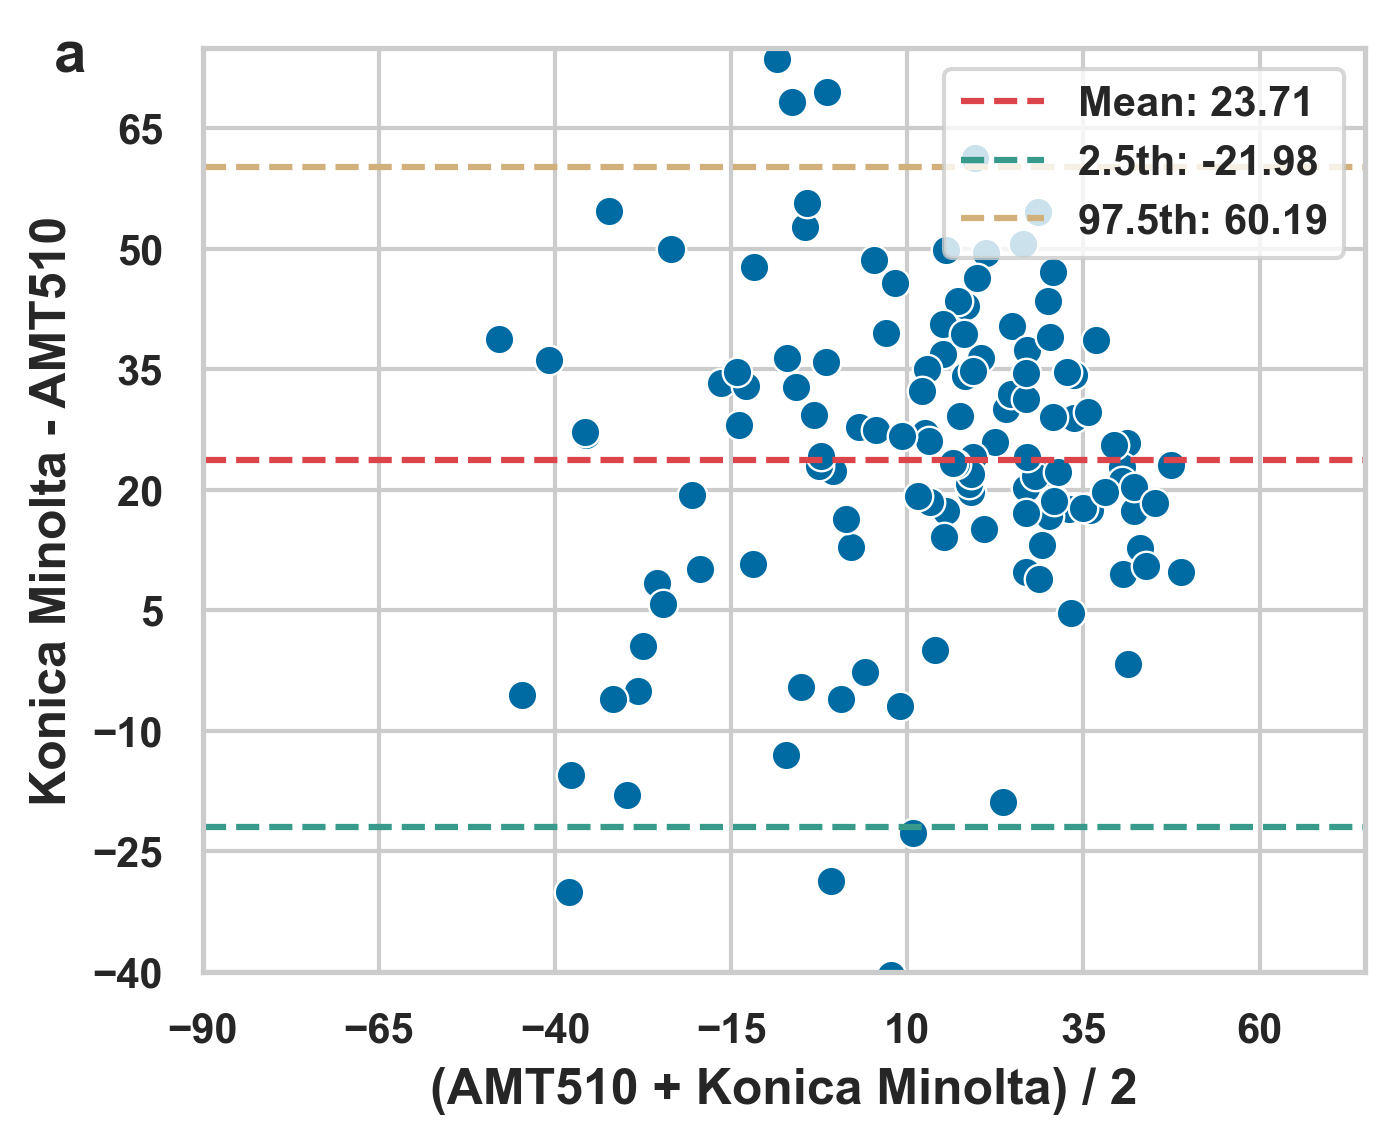
Bland Altman plot for Forehead (F)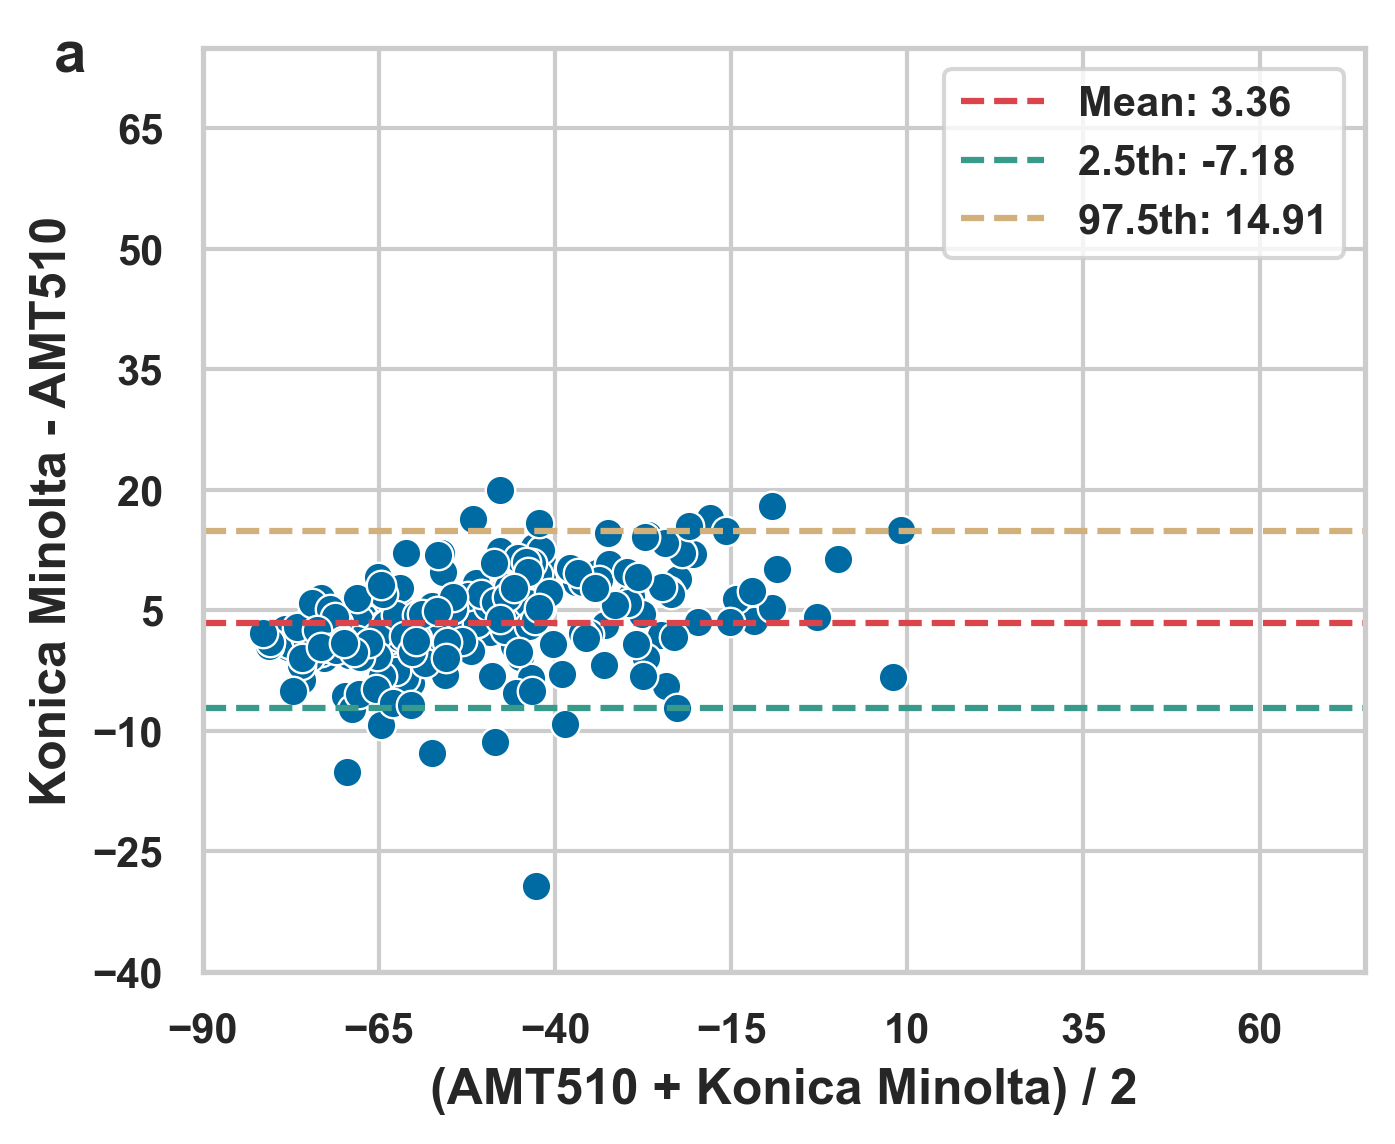
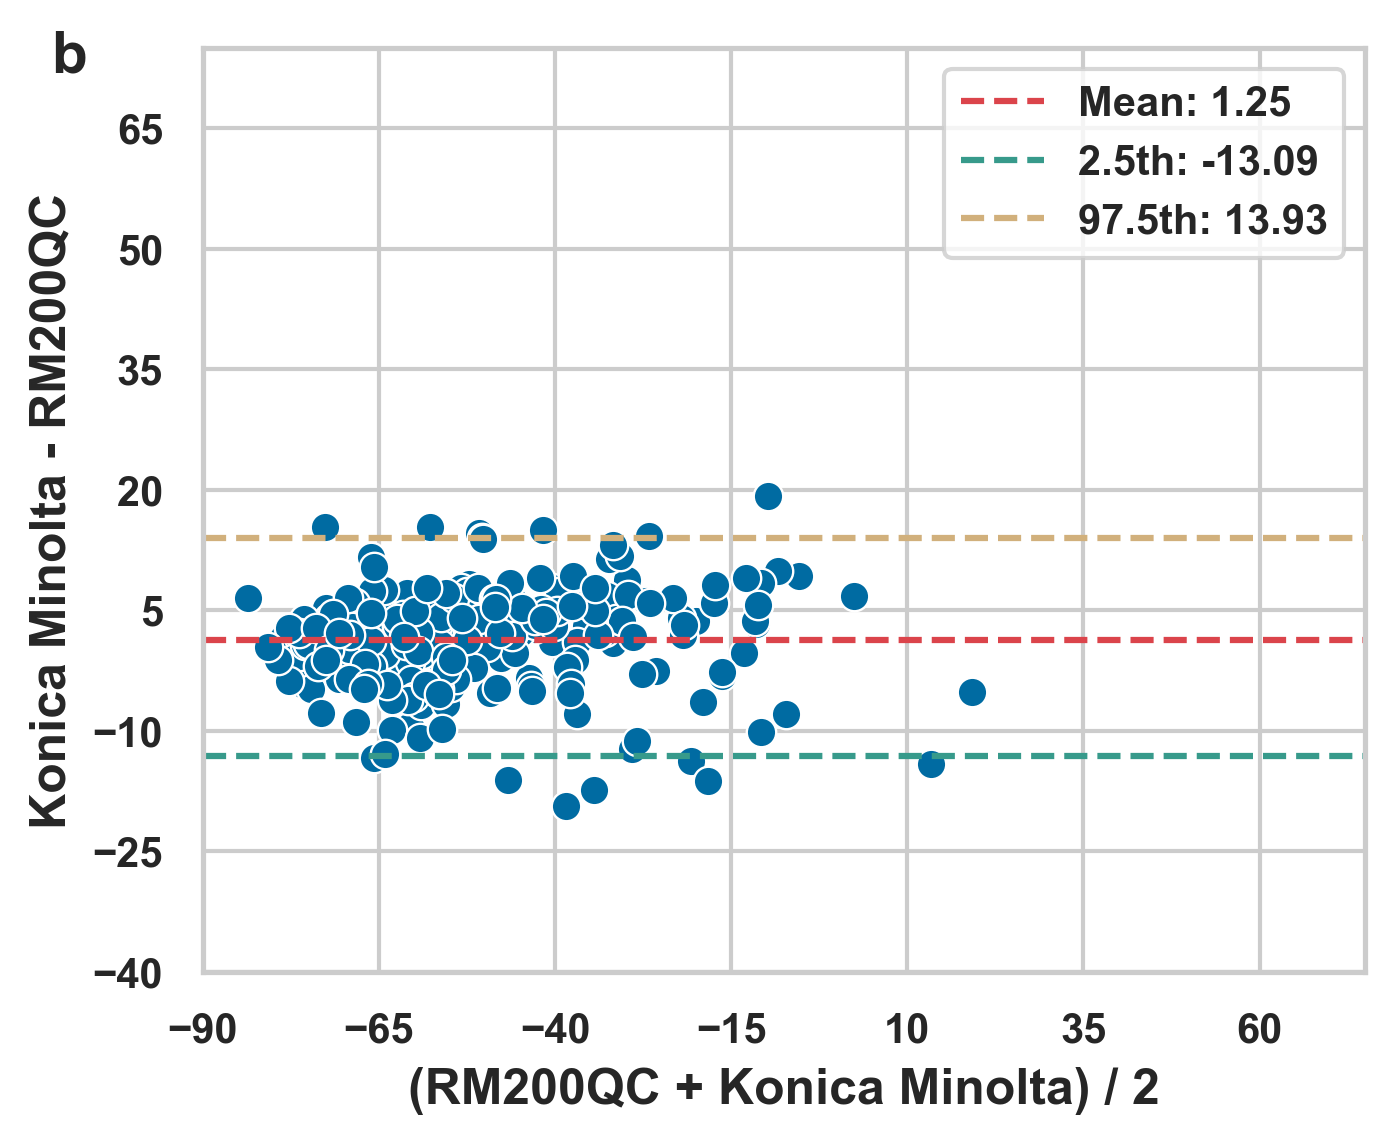
Bland Altman plot for Inner Upper Arm (E)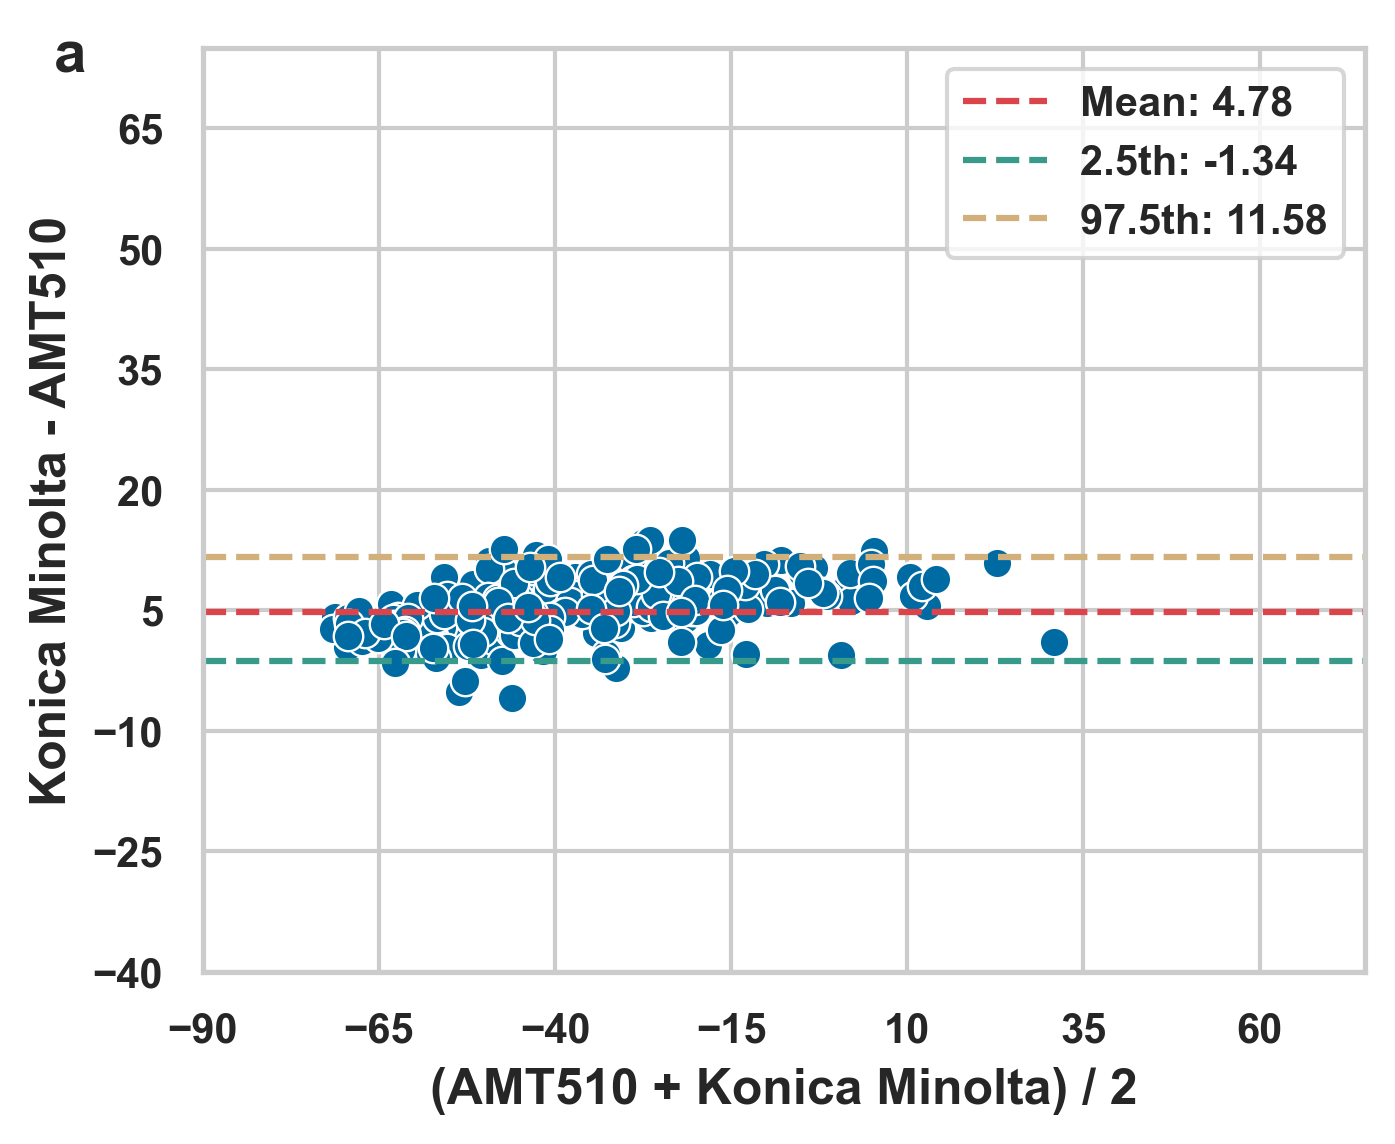
Bland Altman plot for Palmar - Opposite DIP (D)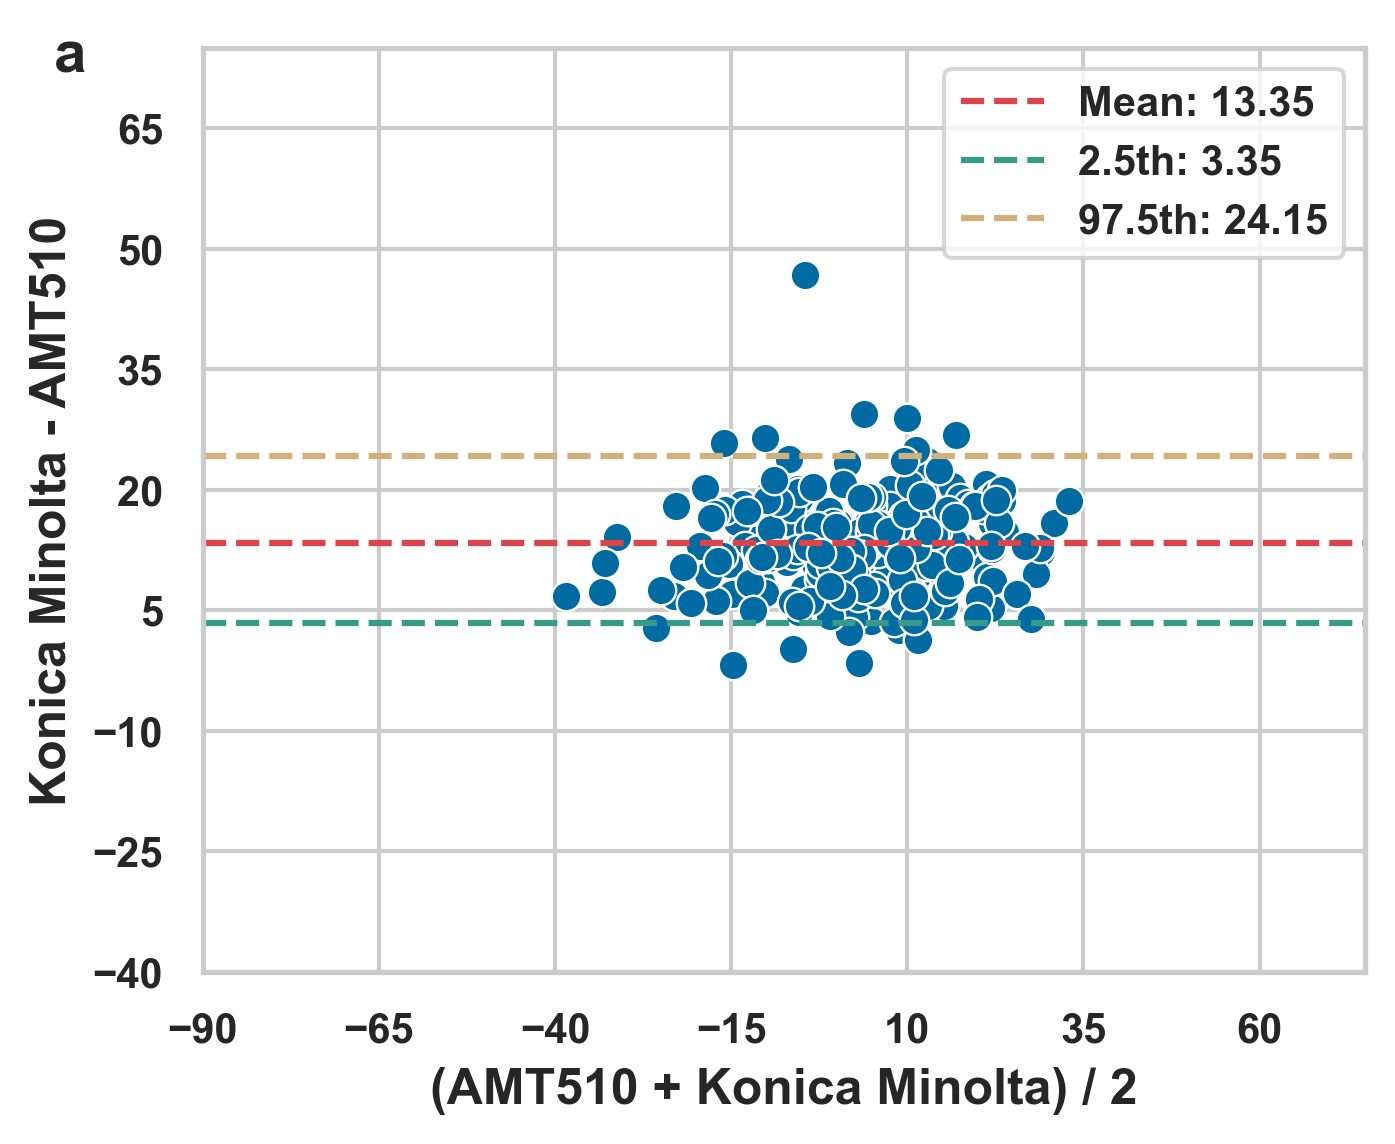
Paired Wilcoxon Test
P-values were <0.001 for most of anatomical sites across the colorimeters, indicating that the ITA values measured by each colorimeter differ significantly from those measured by the KM. Although we see a p-value of 0.8772 at the Fingernail site for the ColorReader Pro, the Spearman’s rho and the Bland Altman analyses suggest that we need to be cautious with the interpretation as lack of significance may due to high variability across the measurements, rather than true agreement between devices.
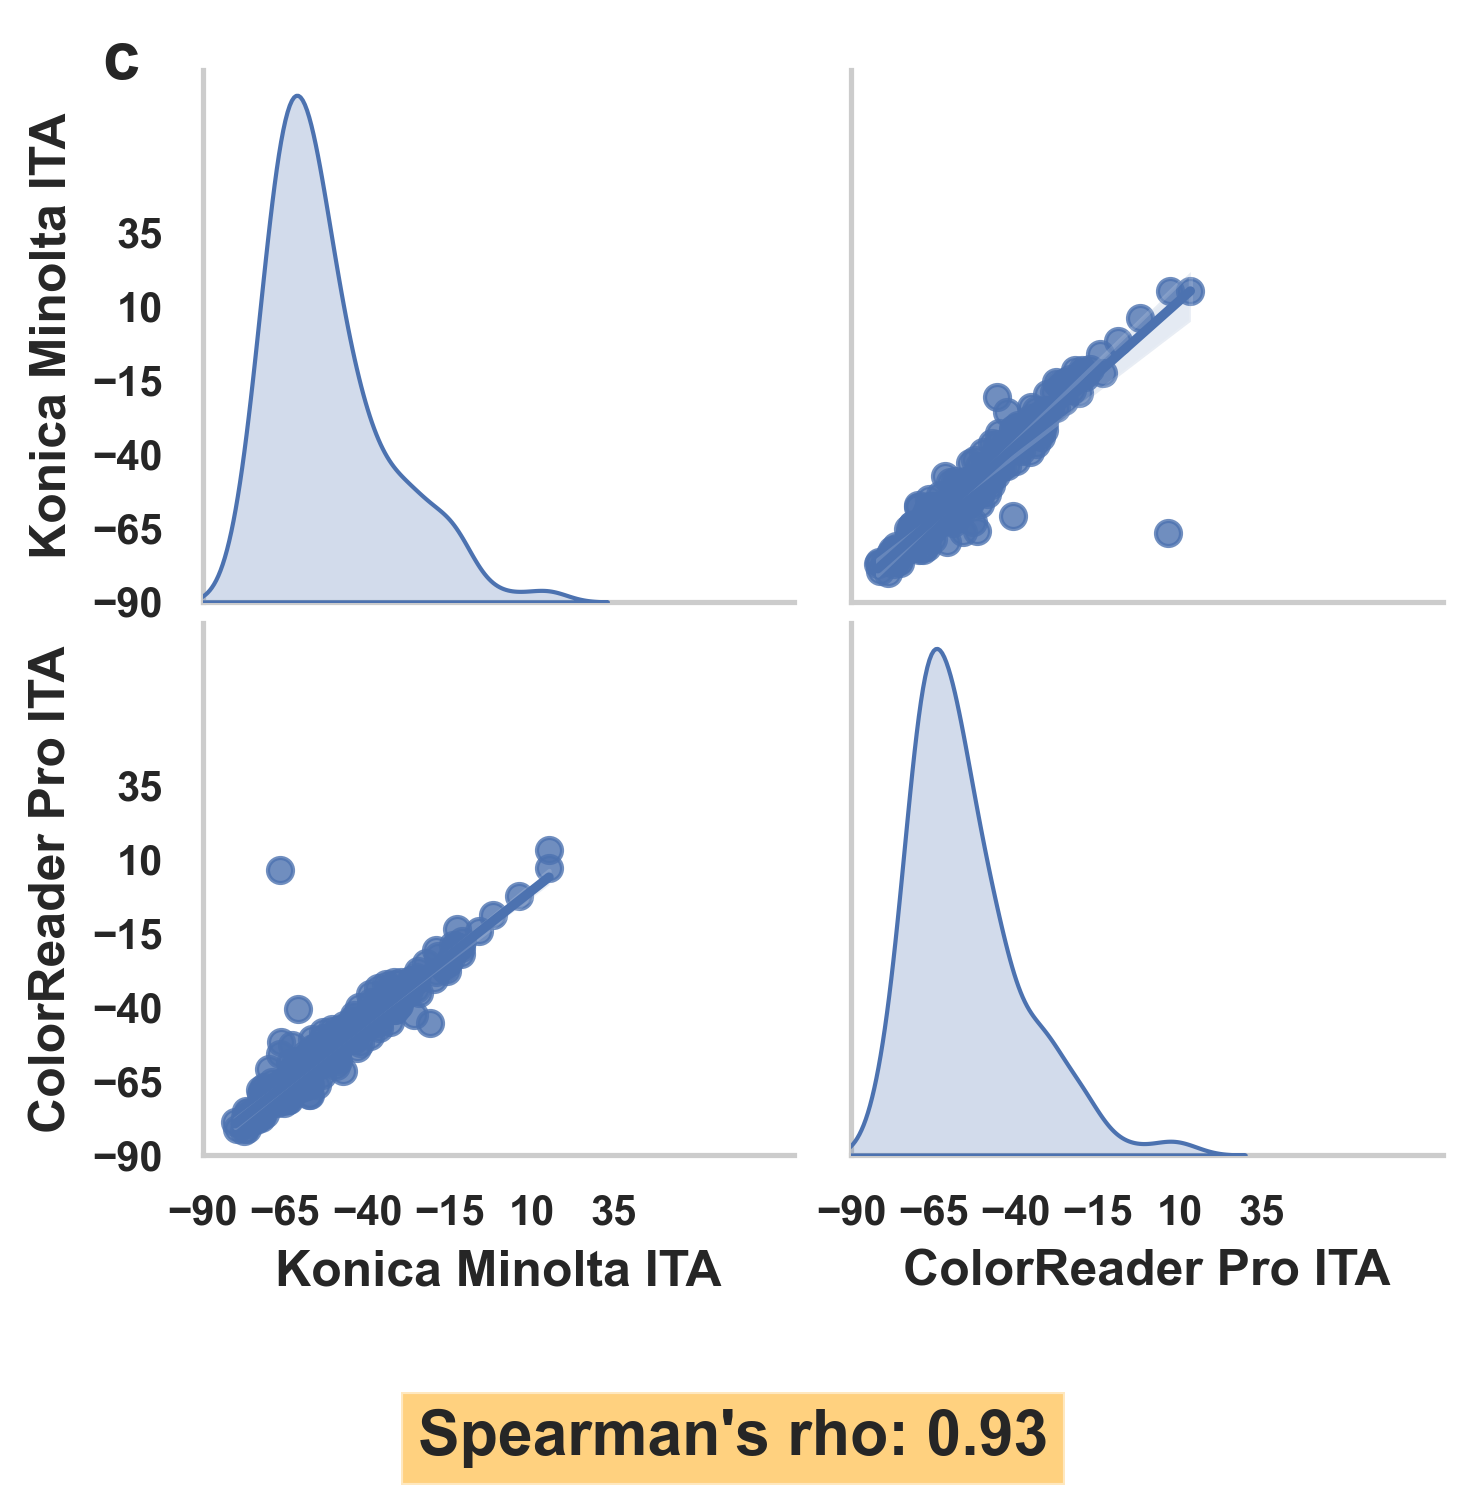
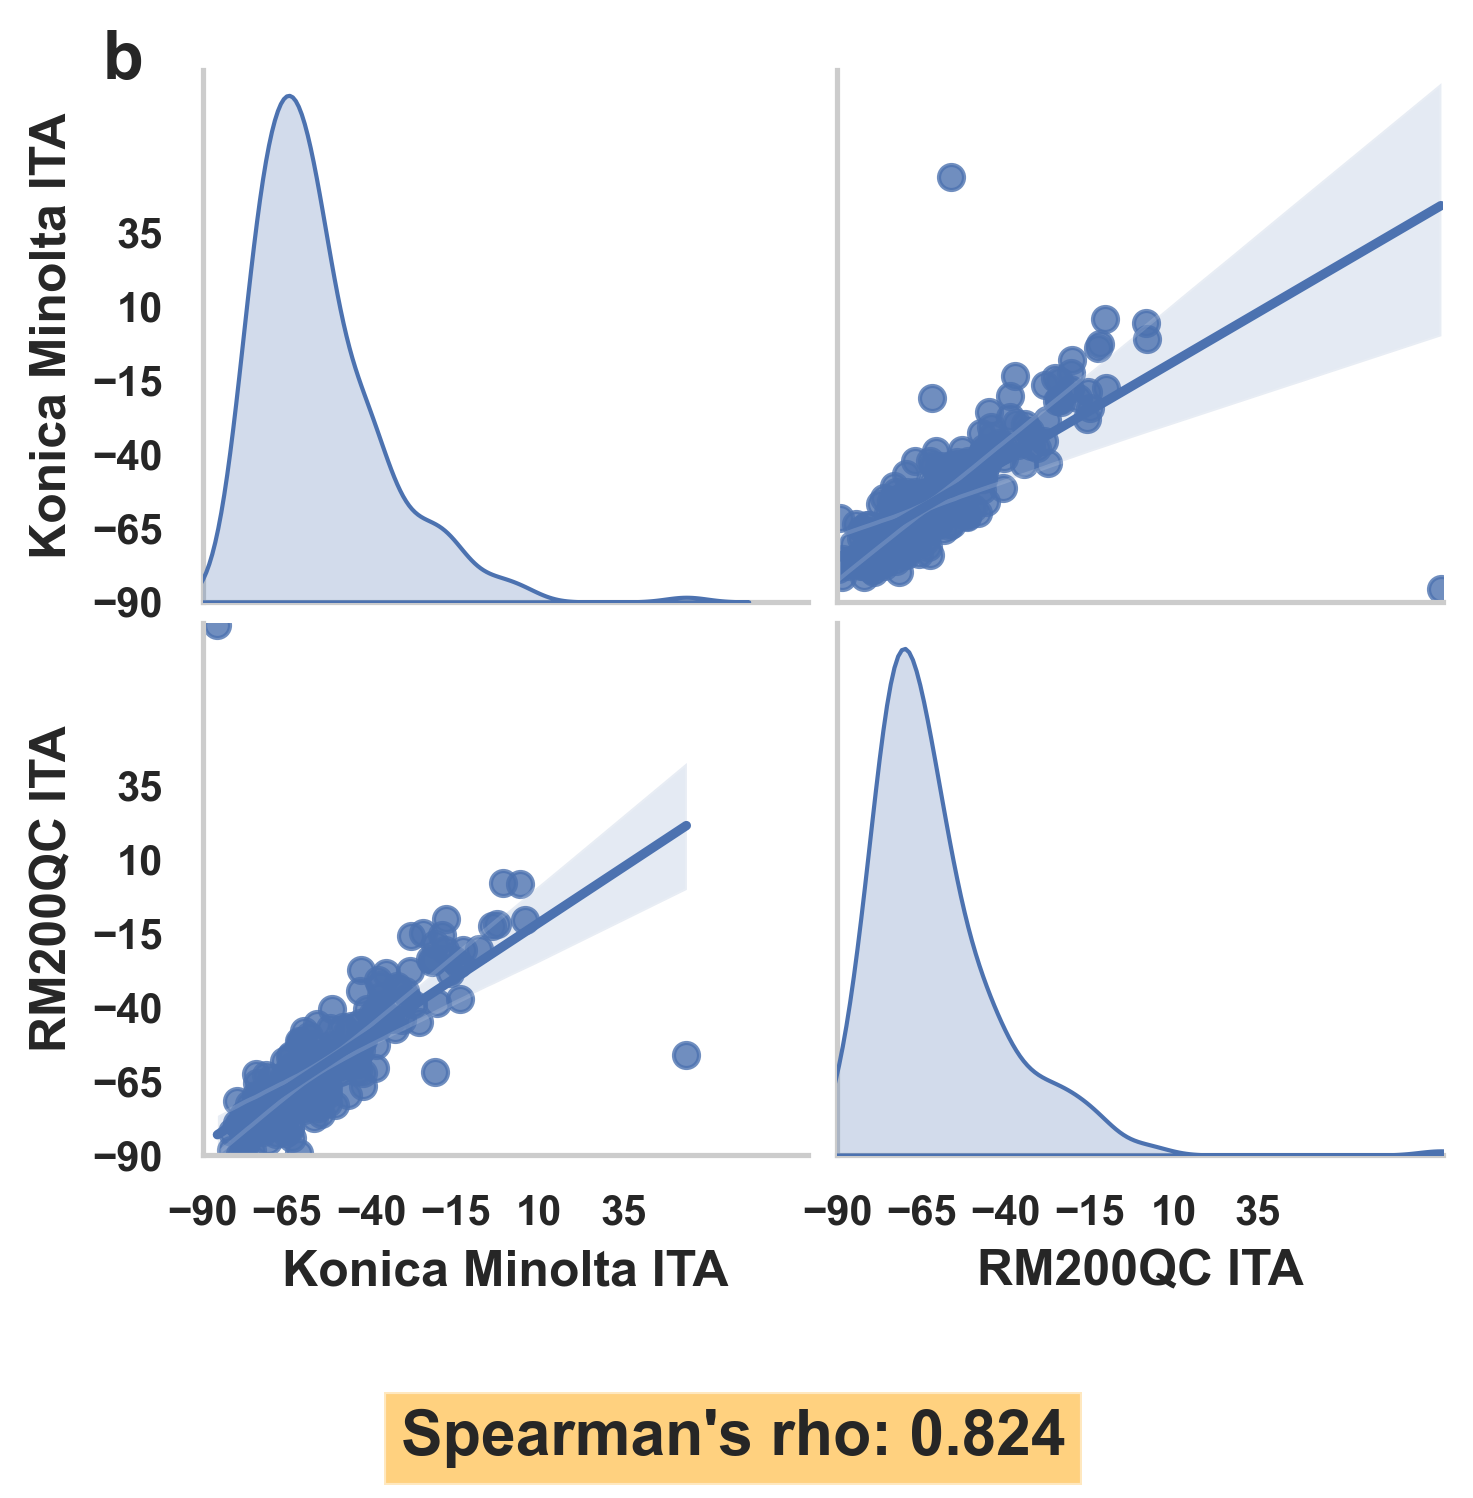
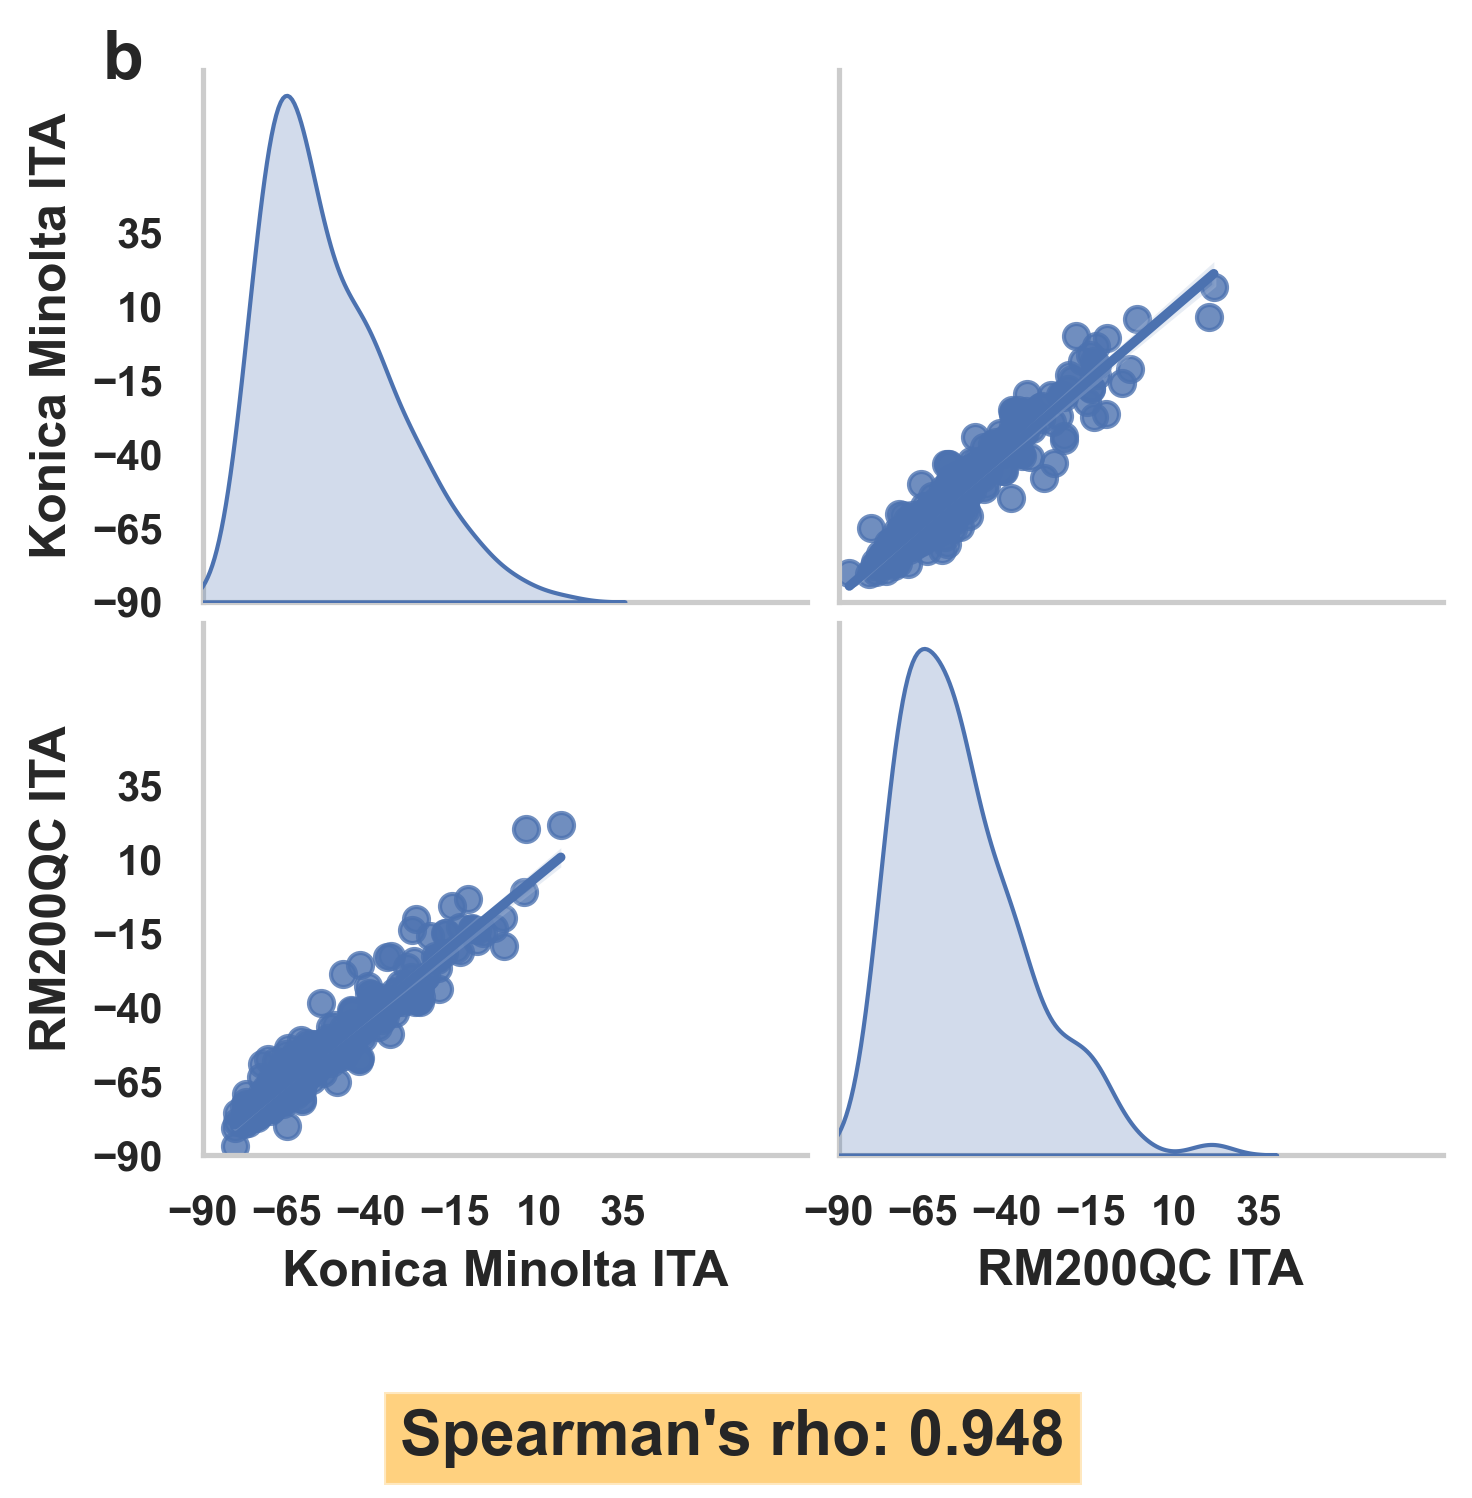
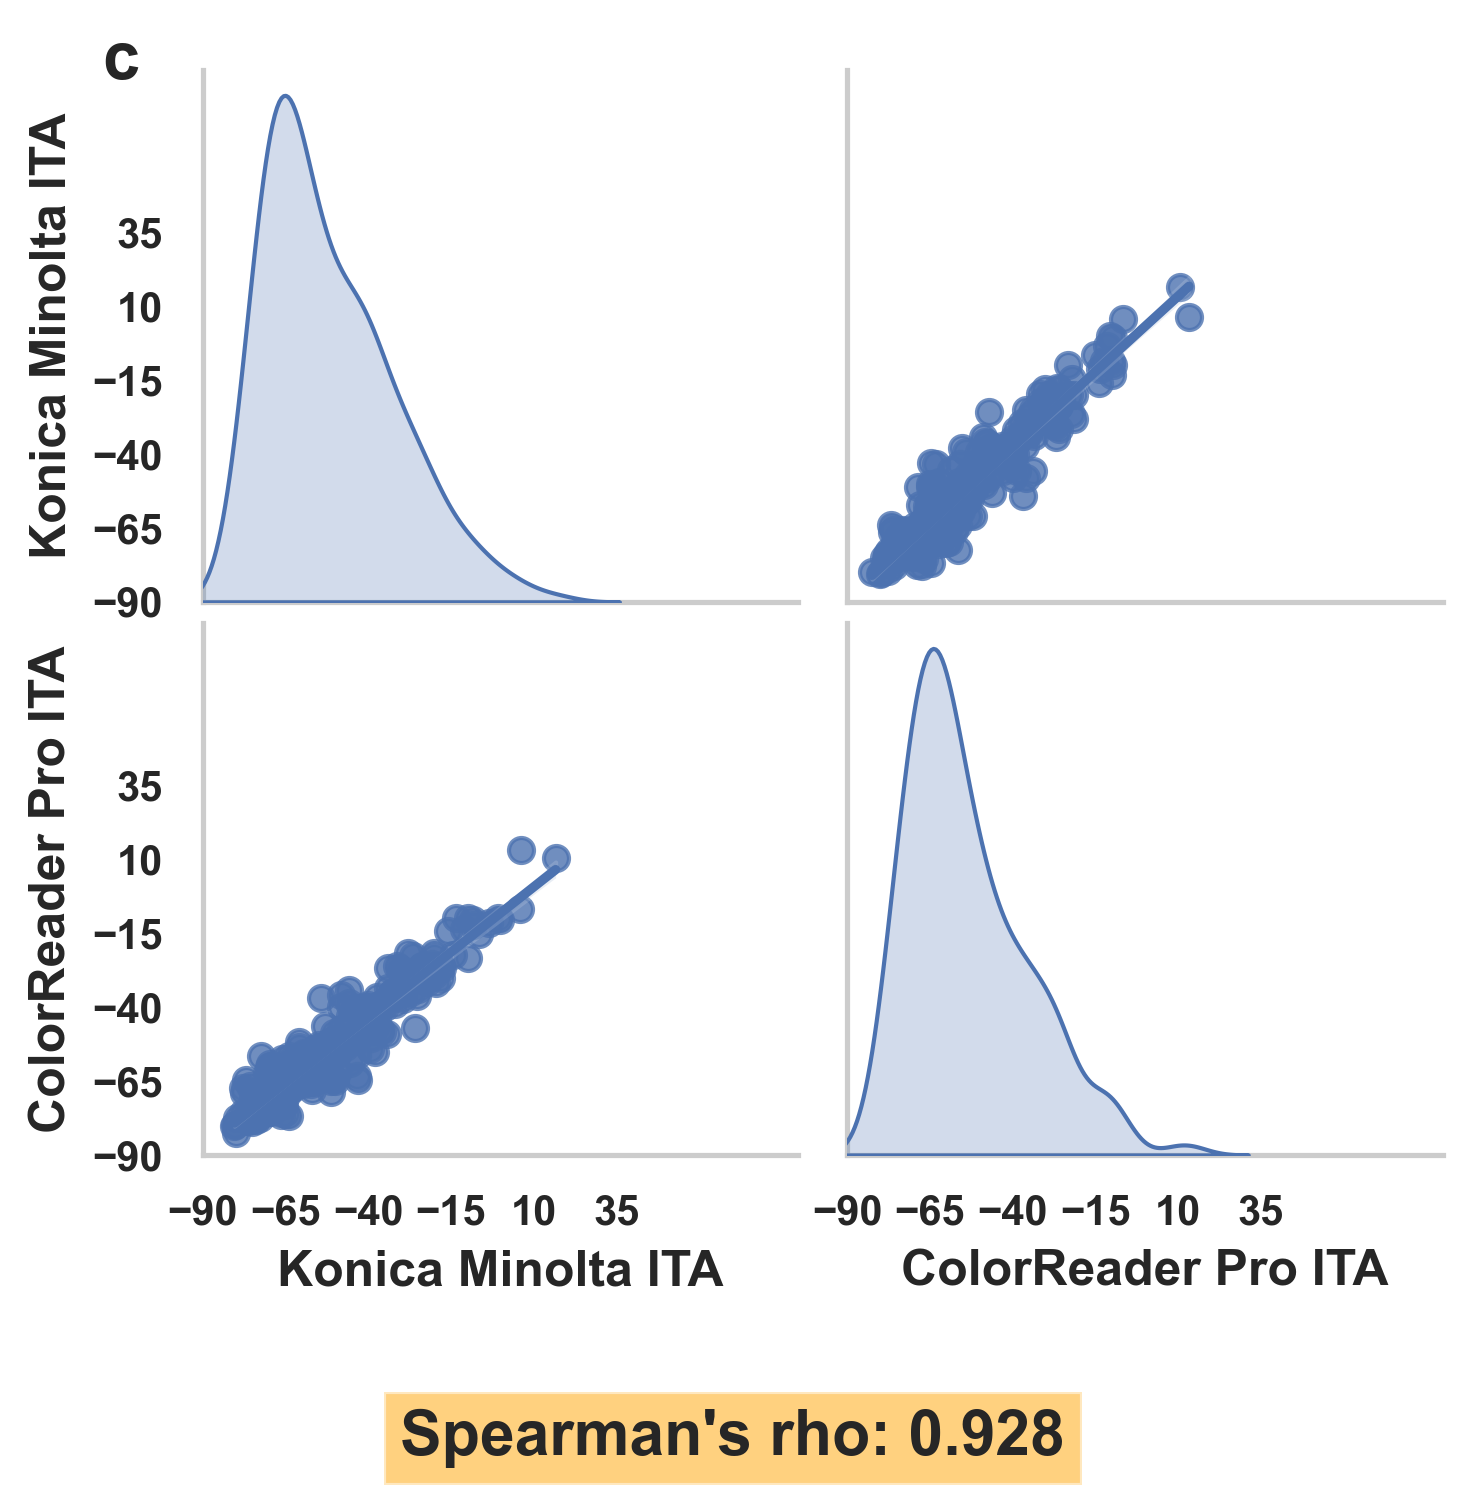
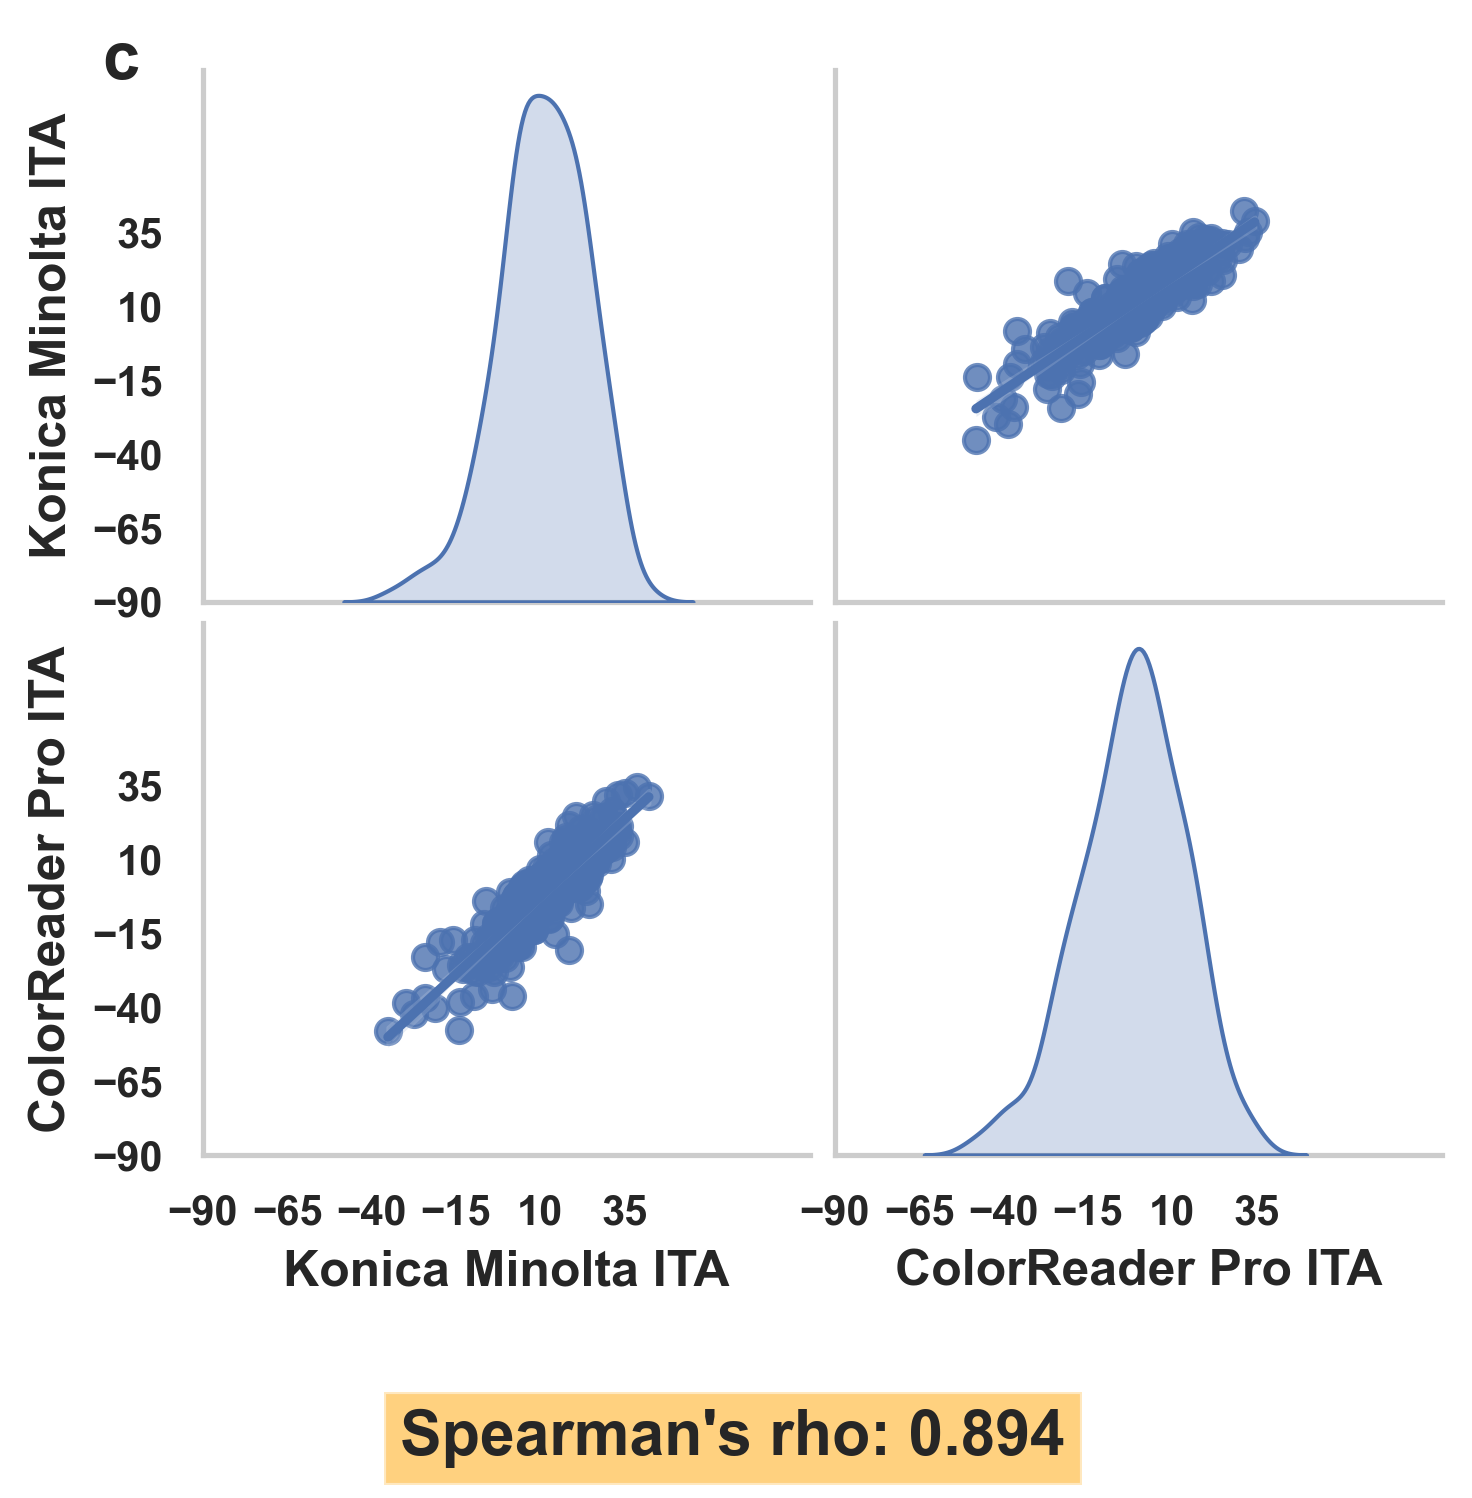
Pairplot and Spearman’s rho
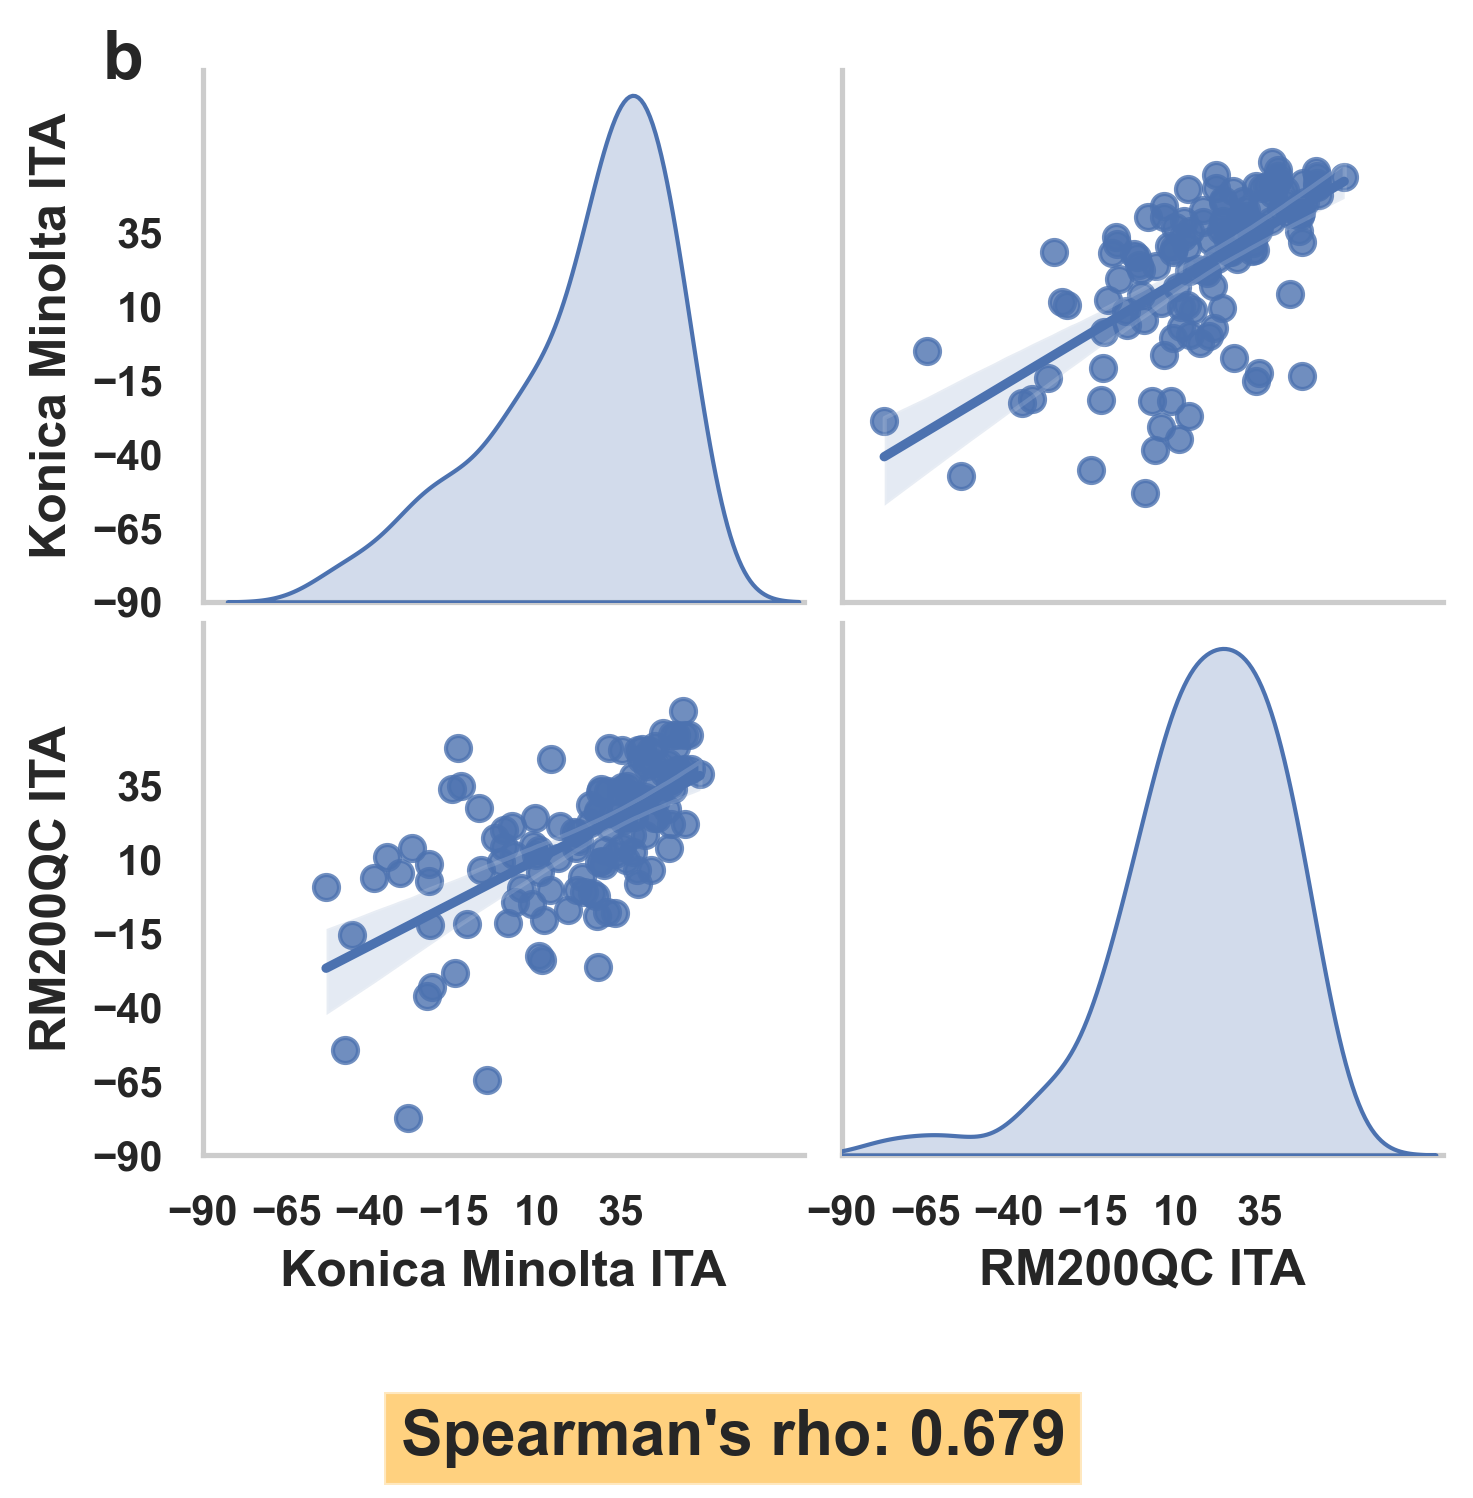
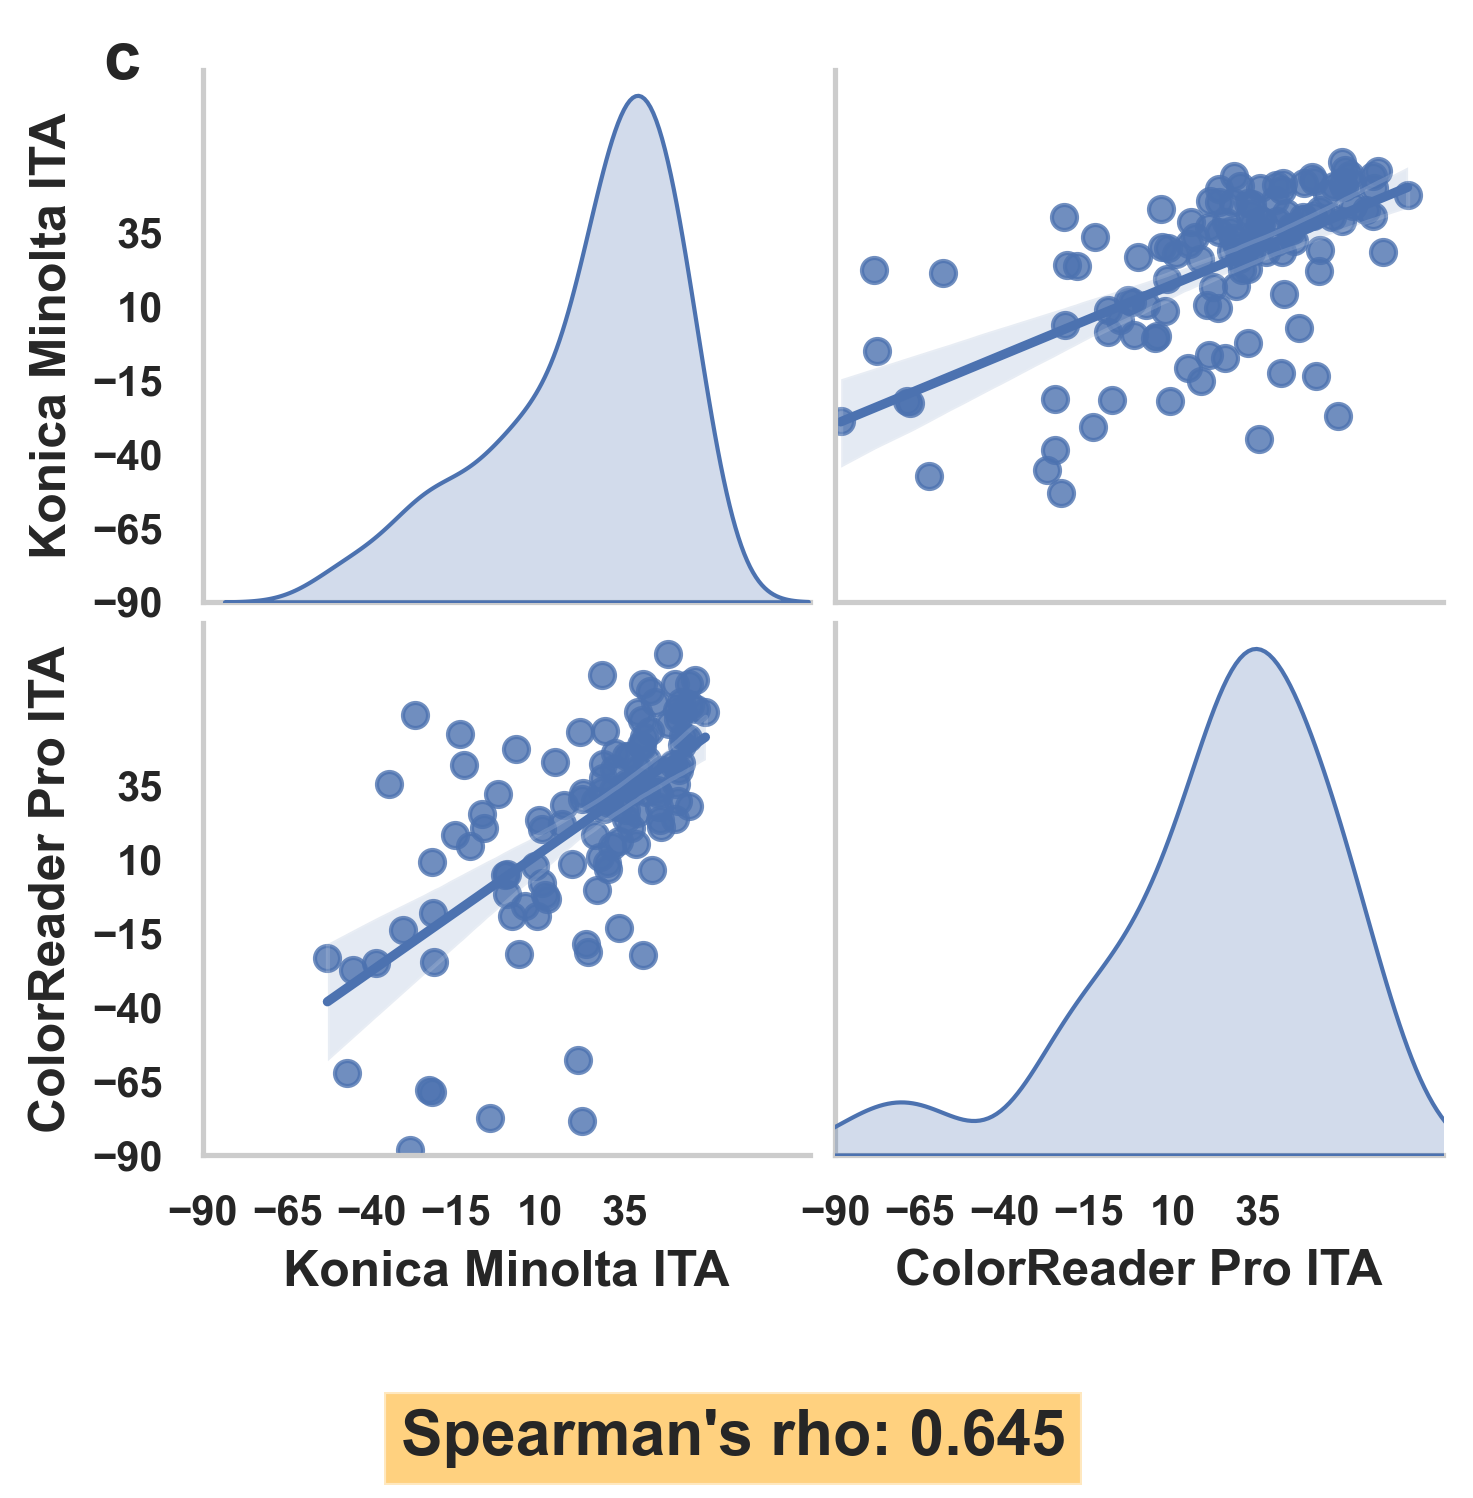
Measurements at the Inner Upper Arm, Forehead, and Back of Hand sites show high Spearman’s rho values (all > 0.90), indicating strong monotonic relationships between the ITA values measured by the colorimeters and the KM. Specifically, the Inner Upper Arm site exhibited the strongest correlations, with Spearman’s rho values exceeding 0.97 across all three colorimeters, suggesting a strong association of ITA values between the colorimeters and the KM. In contrast, for measurements taken at the Fingernail site, Spearman’s rho values were consistently below 0.7 across all colorimeters. This suggests a large inconsistency in measurement between the colorimeters and the KM at the Fingernail site.
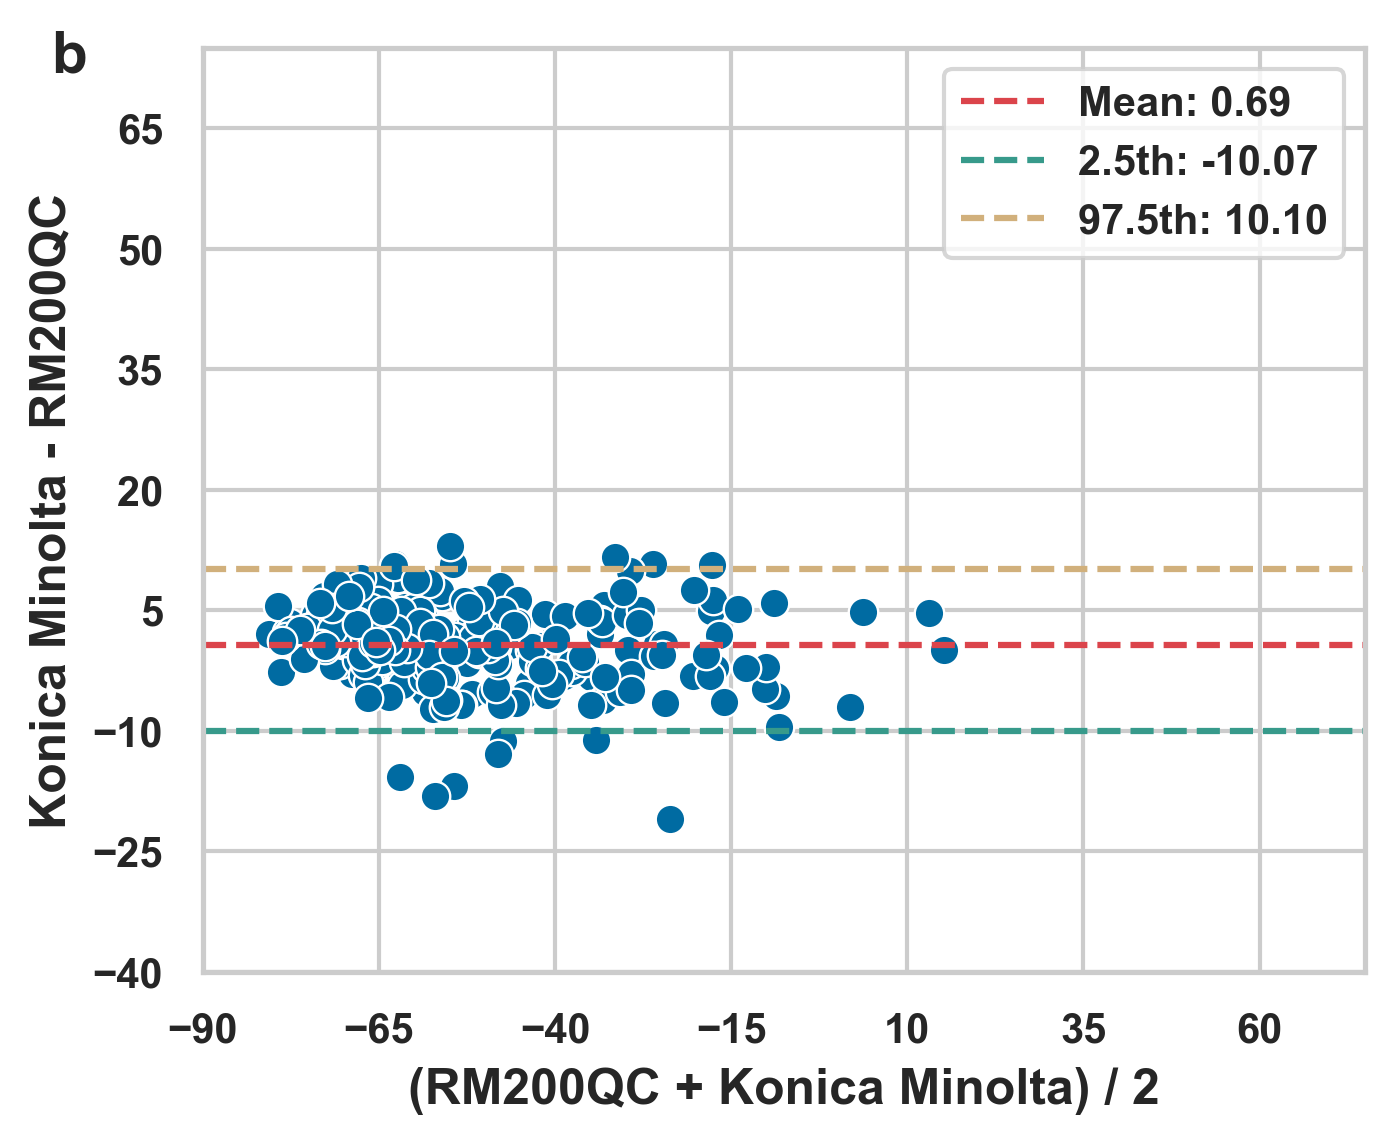
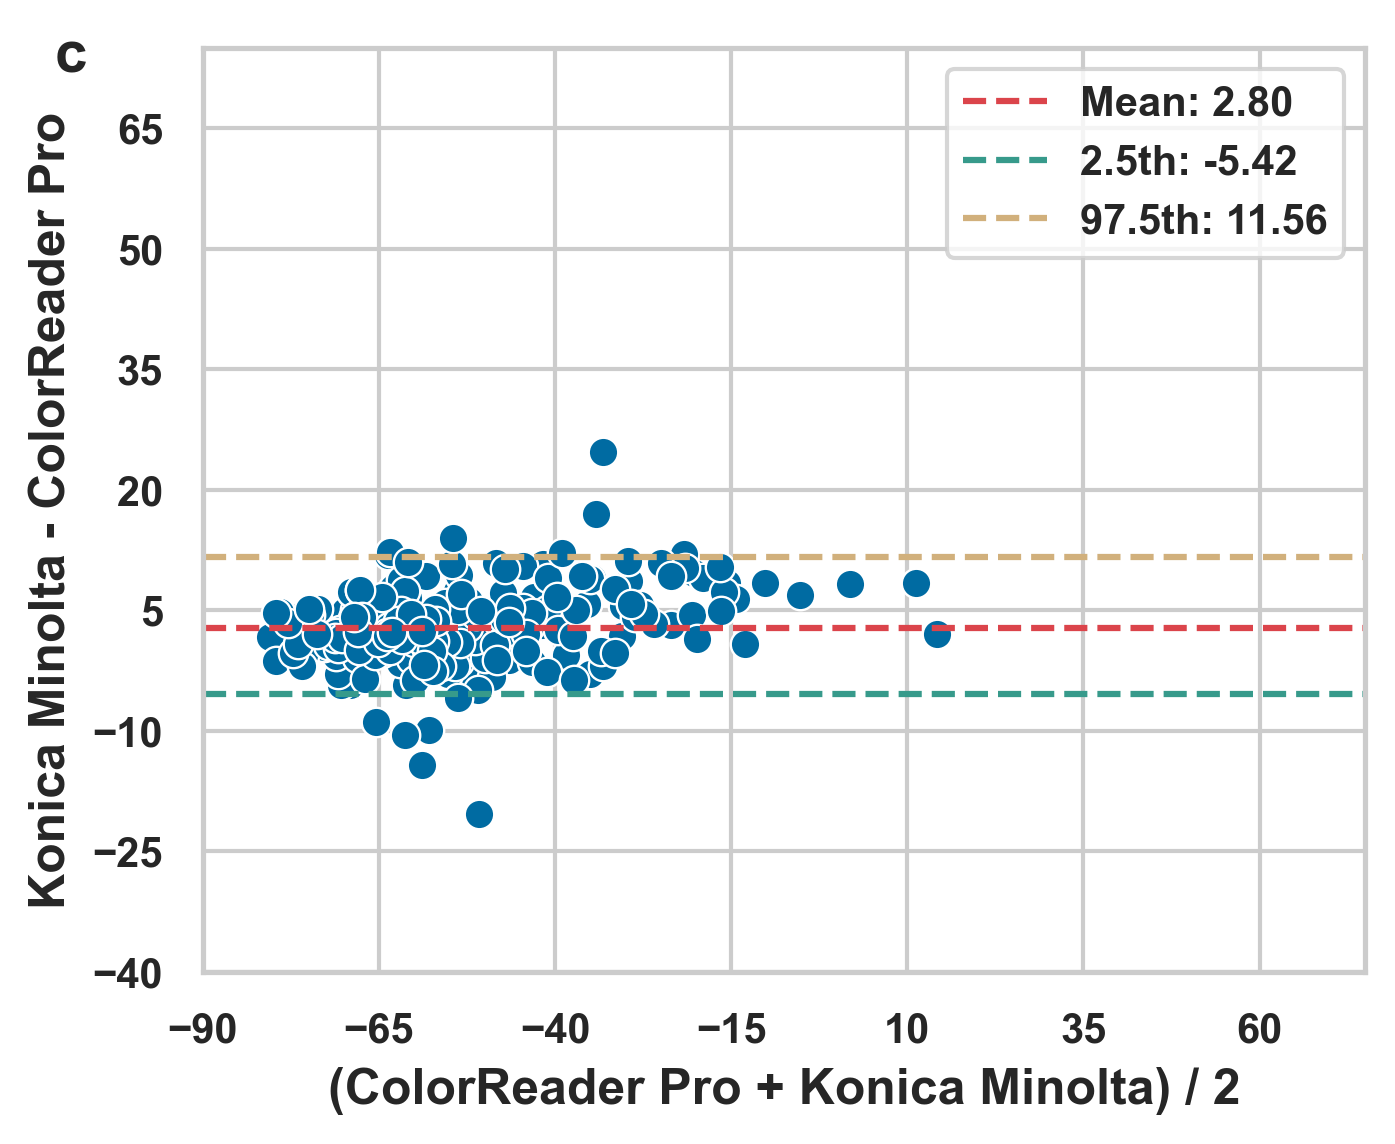
Bland Altman plot
Across most sites, colorimeters systematically underestimated ITA values compared to KM, with mean differences ranging from about 0.5 to 23.7 units. If looking at the 95% limits of agreement (LOA), the Fingernail site shows very wide LOAs, with the LOAs span exceeding 80 degrees. This suggests that, although the mean difference may not be large (mean difference = 0.44 for ColorReader Pro), individual measurements can differ substantially, making the colorimeter and KM measurements at the Fingernail site non-interchangeable.